How to Read and Interpret IR Spectra
In this tutorial, we’ll go over the fundamentals of the InfraRed (IR) spectroscopy.
Now, before you yawn—nope—it’s not going to be one of those tutorials where I bore you with 30 minutes of dry theory. This is a practical guide that’ll teach you everything you need to know about IR, especially how to solve IR spectra and answer exam questions. That’s exactly what you’re going to be tested on.
What is IR?
IR stands for Infrared Spectroscopy as I’ve mentioned above. This is a vibration spectroscopy, which means if something vibrates, it’s going to show up in the IR spectrum. And guess what? All bonds vibrate! There are different types of vibrations, and some of them show up in what we call the “analytical” region of the IR.
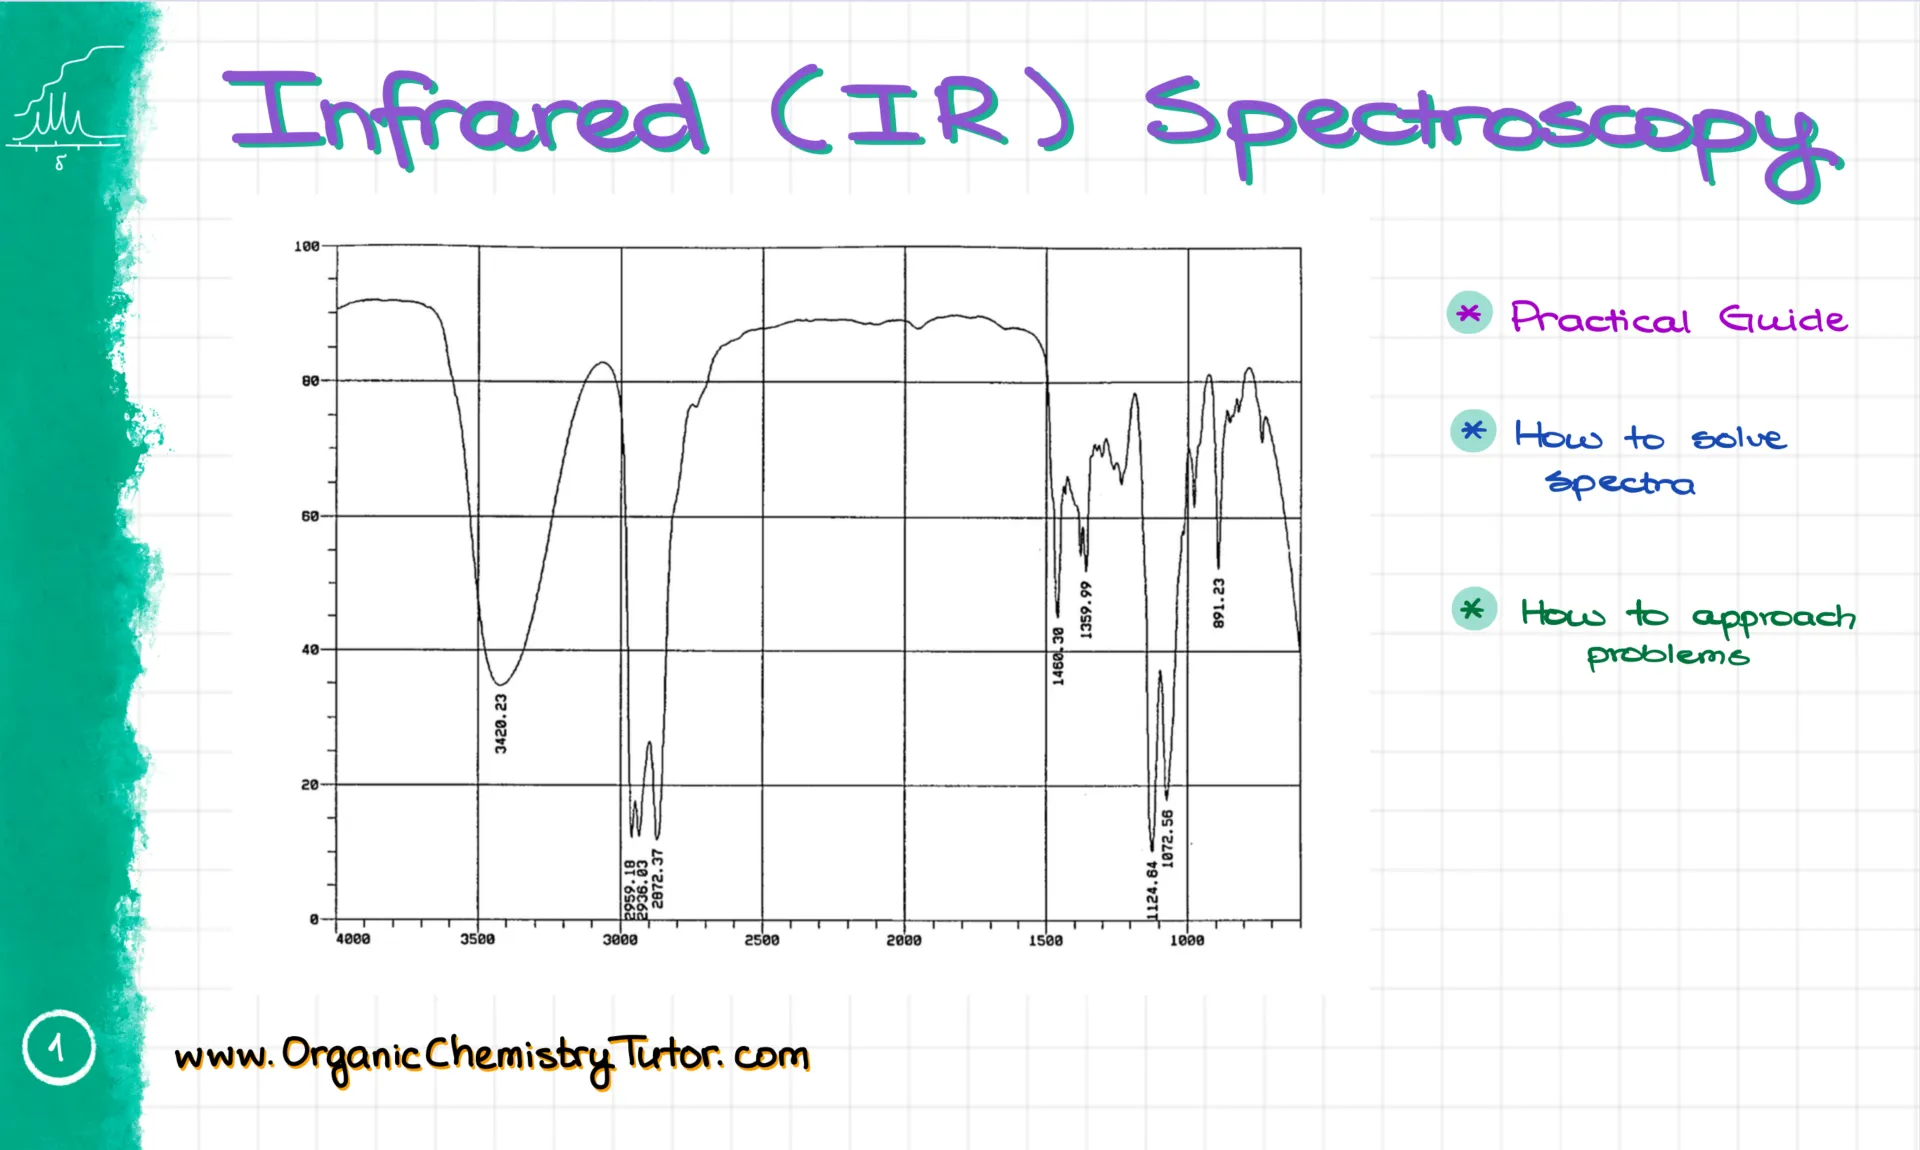
The idea is simple: you shine IR light on a molecule, and different functional groups absorb that light. Because different bonds and functional groups absorb light at different frequencies, we can figure out what’s in the molecule.
For example, on this spectrum, I have something absorbing light in a few different places. But what exactly does that mean?
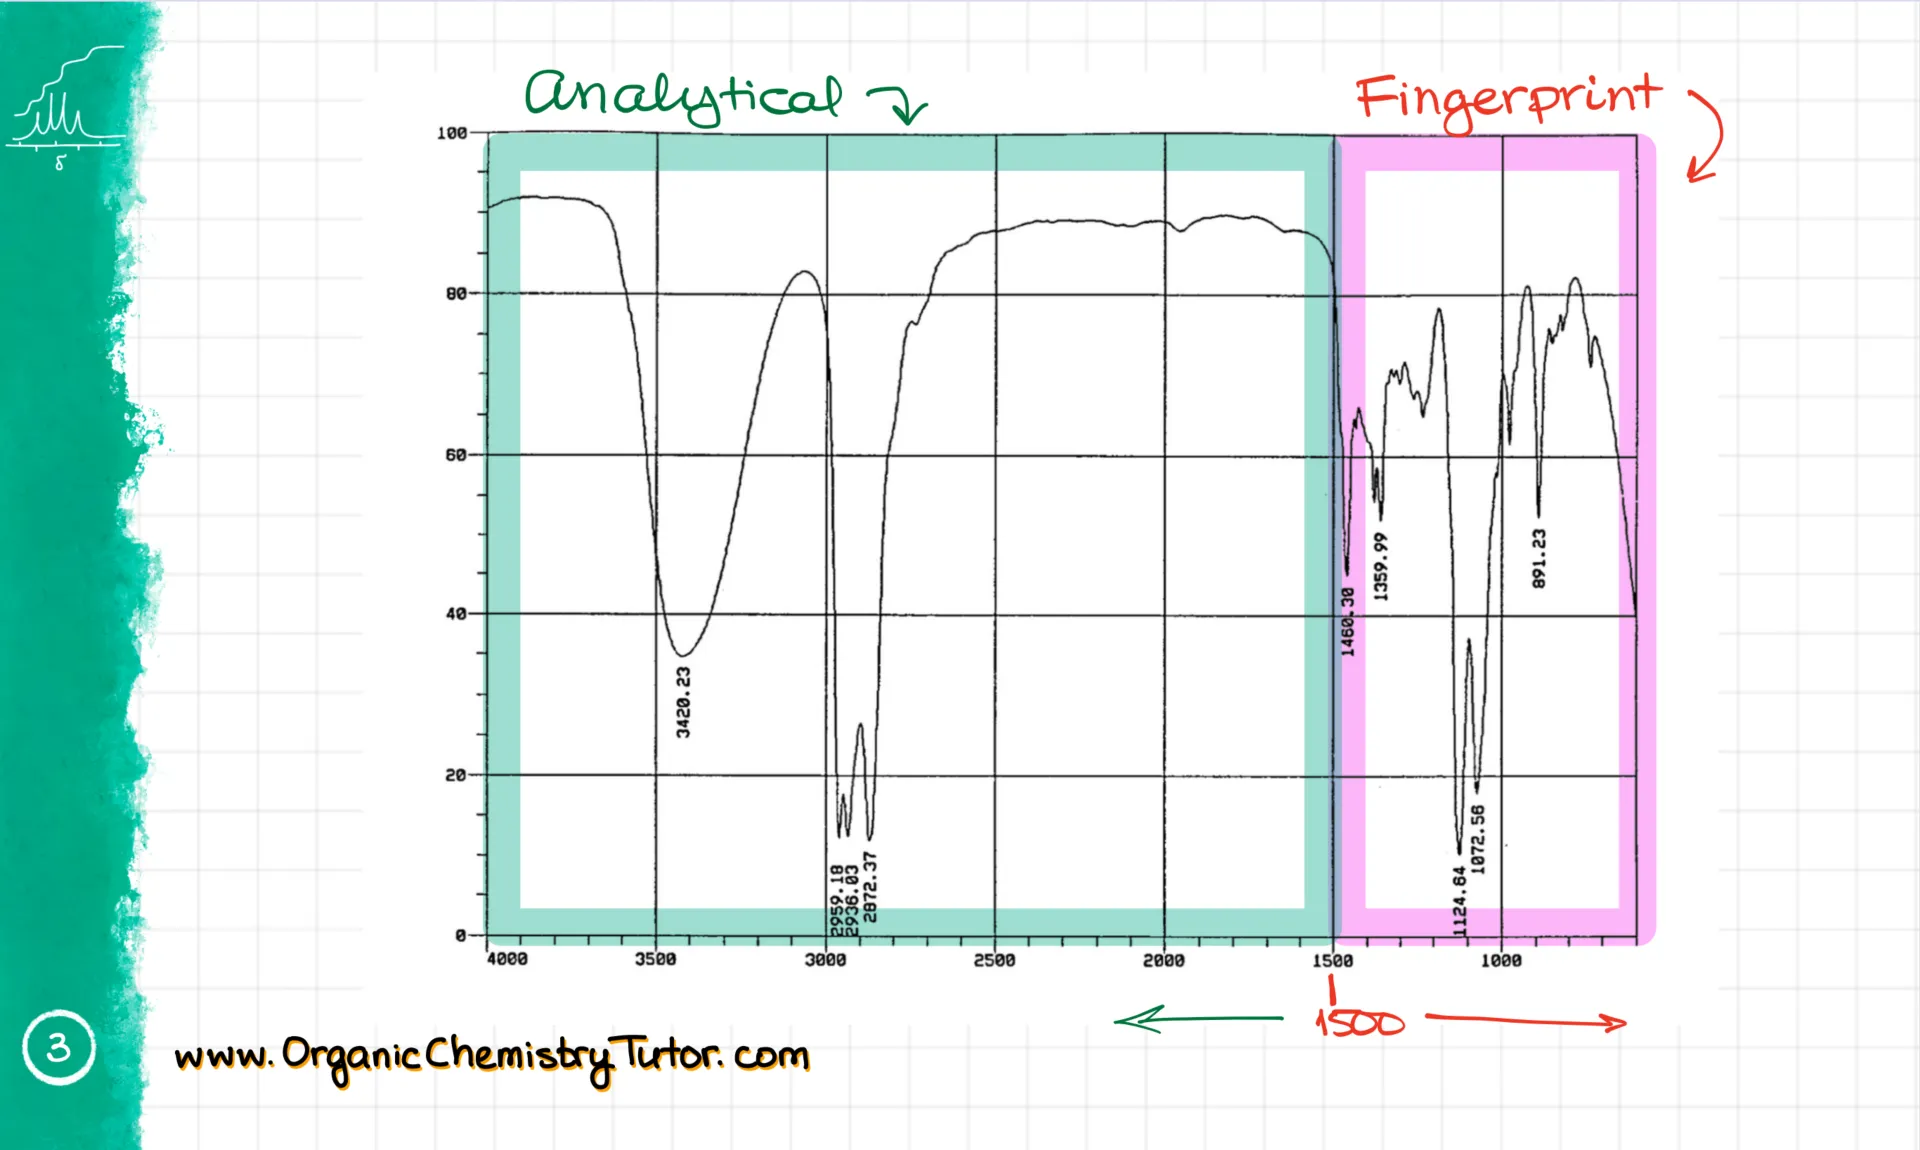
When we look at the IR spectrum, there are two main regions. First, there’s the fingerprint region, which is below 1500 cm⁻¹. Then, there’s the analytical region, above 1500 cm⁻¹. Everything we really care about lives in the analytical region. The fingerprint region is only useful if you’re comparing a molecule to a known sample. It works like a fingerprint—unique for every molecule—but it’s incredibly hard to interpret unless you know exactly what you’re looking for. So we’ll leave that to the pros and stick to the analytical region.
What kind of information can we get from the analytical region in IR?
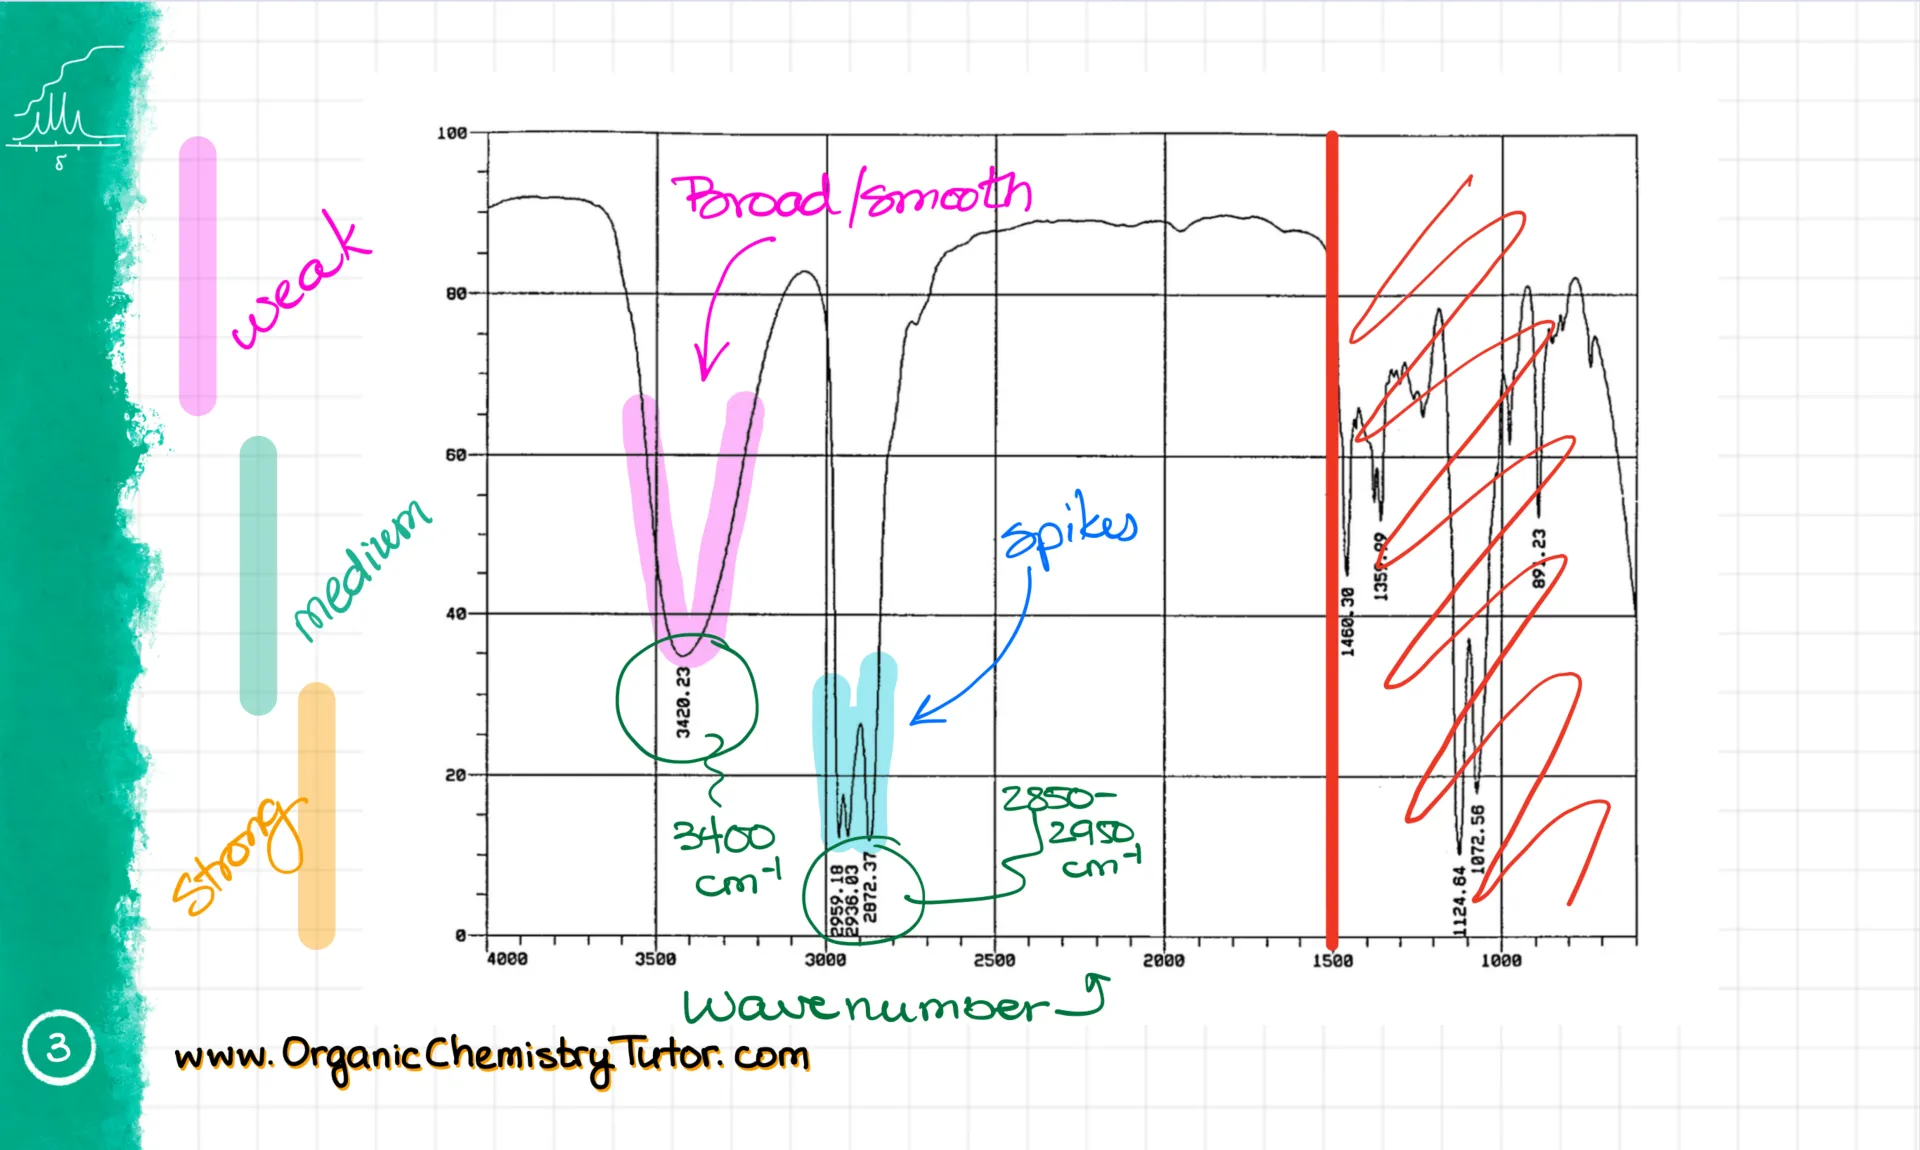
First, we get the wavenumber. It’s typically expressed in cm⁻¹, and it’s basically a vibrational frequency. The higher the wavenumber, the higher the energy of the bond vibration. So for example, on this spectrum, I have a couple of signals: one at about 3400 cm⁻¹, and another between 2850 and 2950 cm⁻¹.
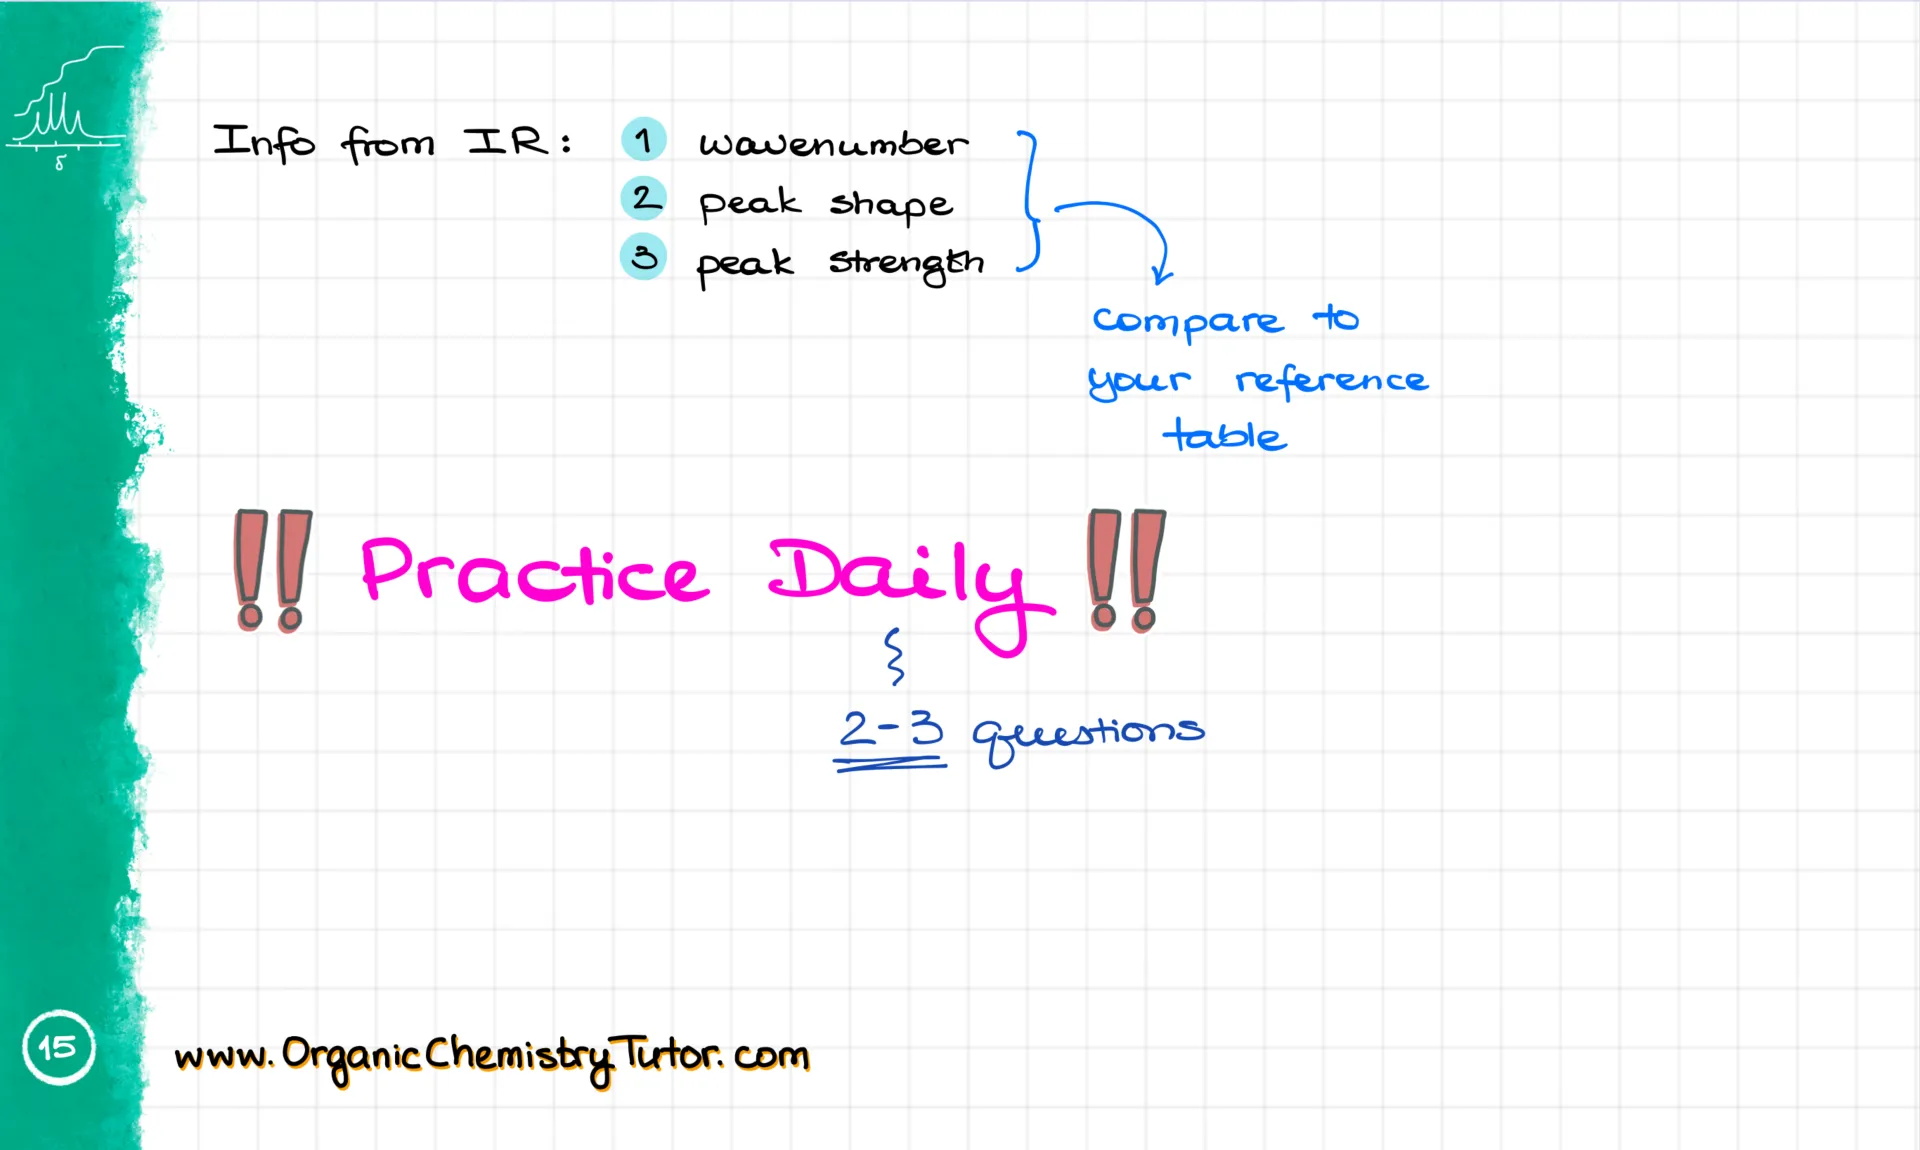
We also pay attention to the signal’s shape. Some signals are broad and smooth, others are spiky. And finally, we look at signal strength. A signal is strong if it dips below 30% transmittance. It’s medium if it’s somewhere in the middle, and weak if it stays above 70% or so.
Now, signal strength is the least important of the three because it can vary depending on how the spectrum was obtained. Whether it’s a thin film, a KBr pellet, or a nujol mixture, the strength can change. But what stays more or less consistent is the position of the signal and its shape. [Note: yes, the signal position is not set in stone and can slightly vary from spectrum to spectrum based on how the sample was prepared and which IR technique was used to acquire the spectrum.]
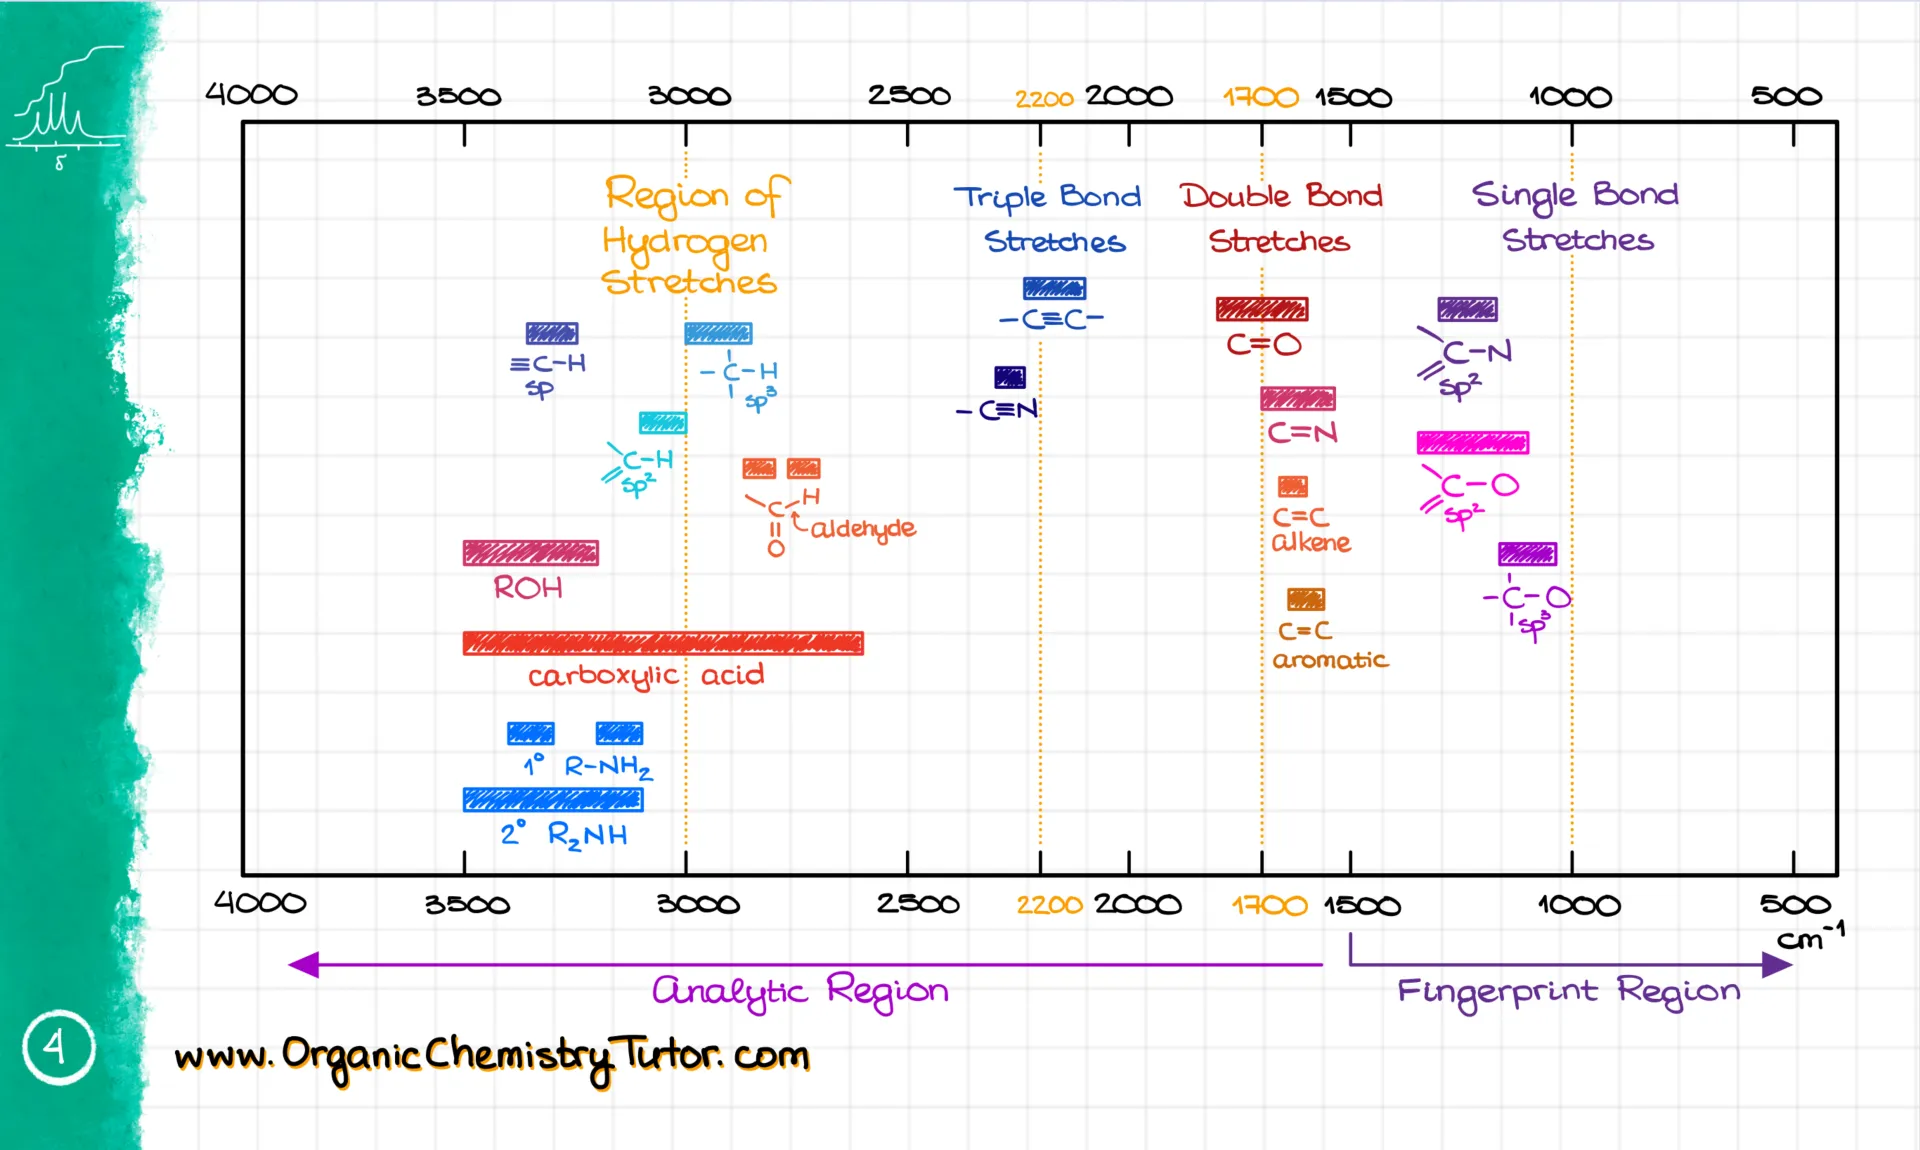
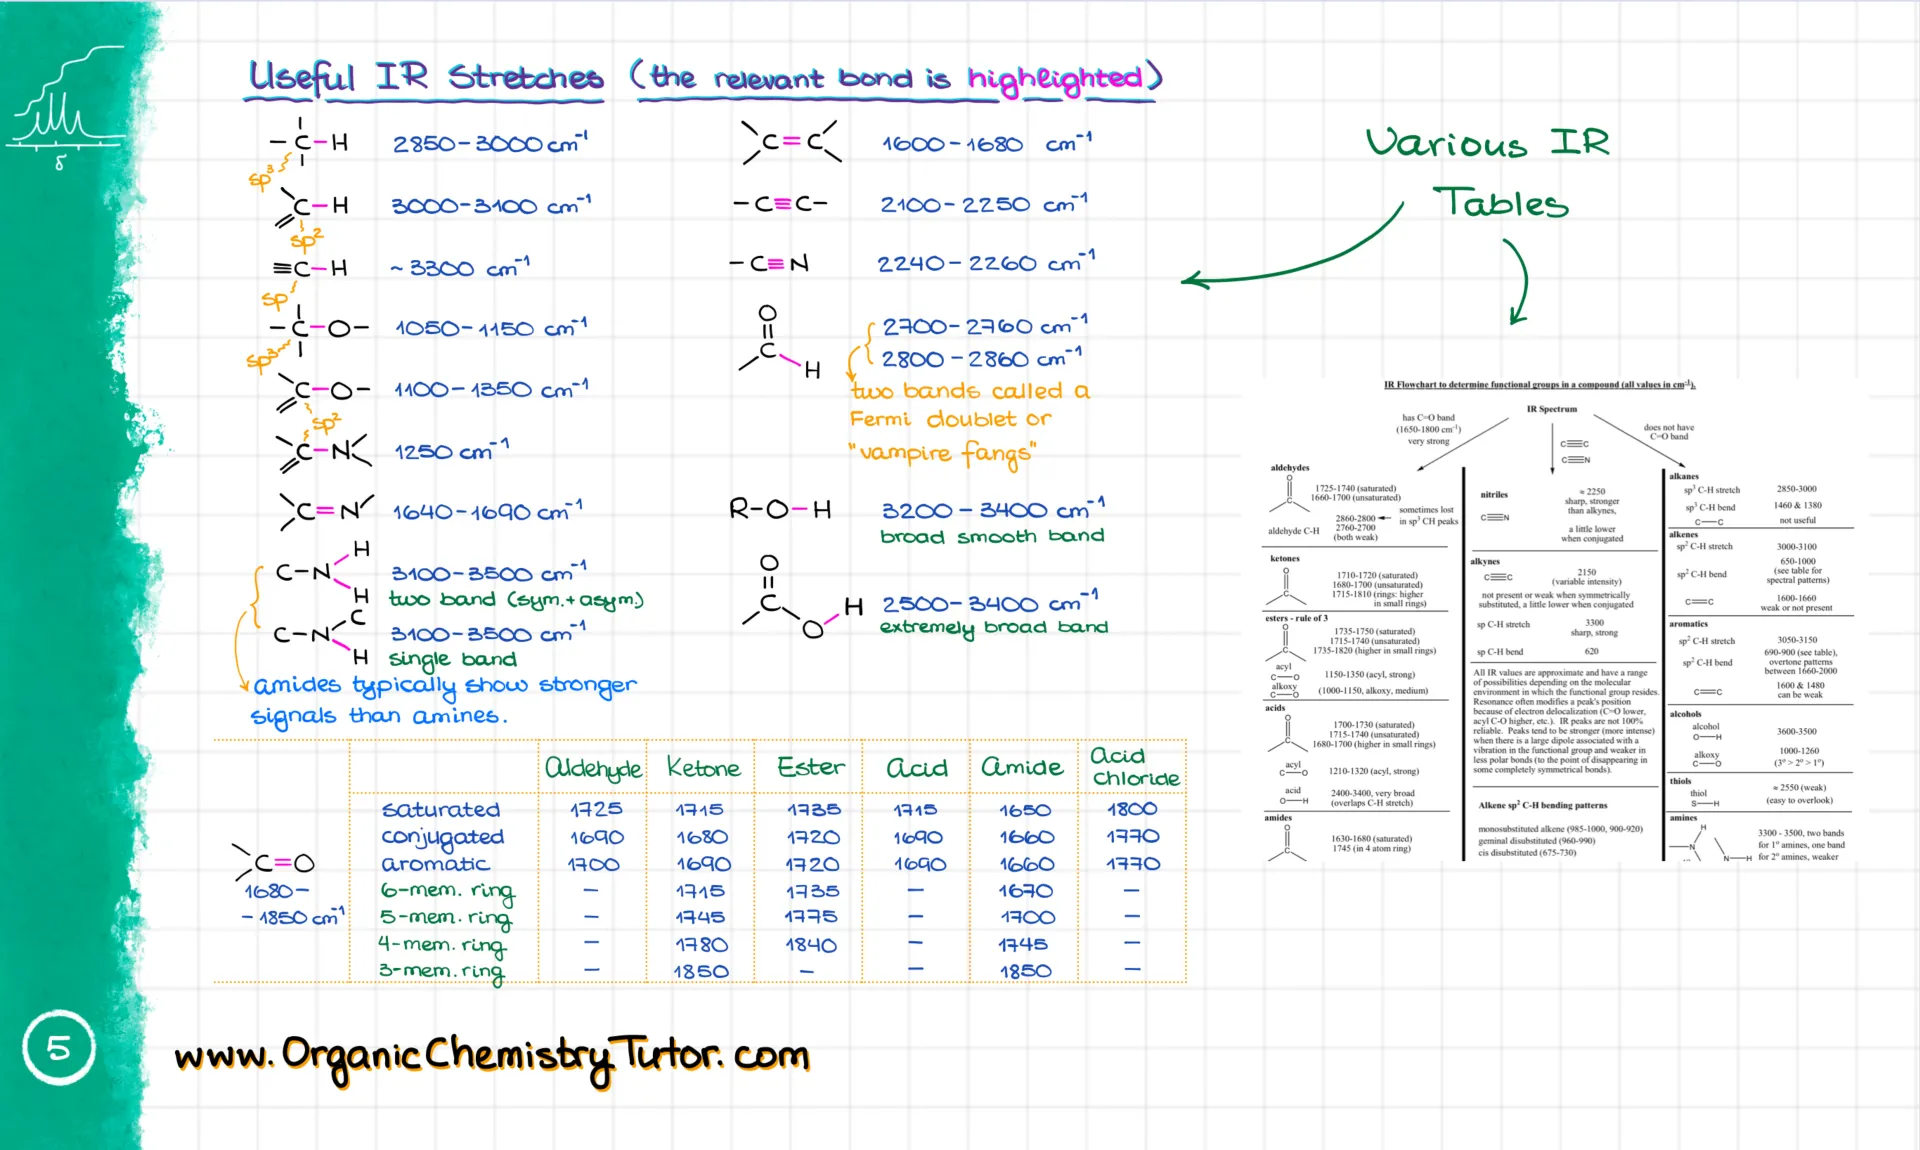
Once you’ve got the wavenumber and shape, you match them with a reference table. Here’s the one I give to my students—it visually shows where the signals are, so it’s super easy to match. I have my colorful version, but your textbook probably has something similar, even if it’s not as pretty 😉.
Or you might get a regular table version. I suggest you pick the one that works for you and get really good at using it. I’m not going to tell you to memorize the most common numbers—but I’m also totally telling you to memorize the most common numbers. Here’s why: even if you know your table by heart, flipping through it still takes a few seconds. Those seconds add up on a test. But the good news? You’ll memorize the numbers just by doing enough problems.
Which brings me to the most important point of this tutorial: You must work through a ton of problems. That’s not optional. If you want to be good at this, you need practice.
And when I say practice, I don’t mean watching someone solve problems. I mean actually solving them yourself. Recognizing how someone else solved a puzzle and solving it yourself are two totally different skills.
But enough ranting. Let’s get back to IR.
How to approach the IR spectra
When I solve IR spectra, I always look at the spectrum from left to right. The area around 3500 cm⁻¹ usually has -OH and -NH groups. For instance, this broad and smooth signal is the -OH group. I know it’s not an NH because the NH signal is weaker and much sharper—like this one here.
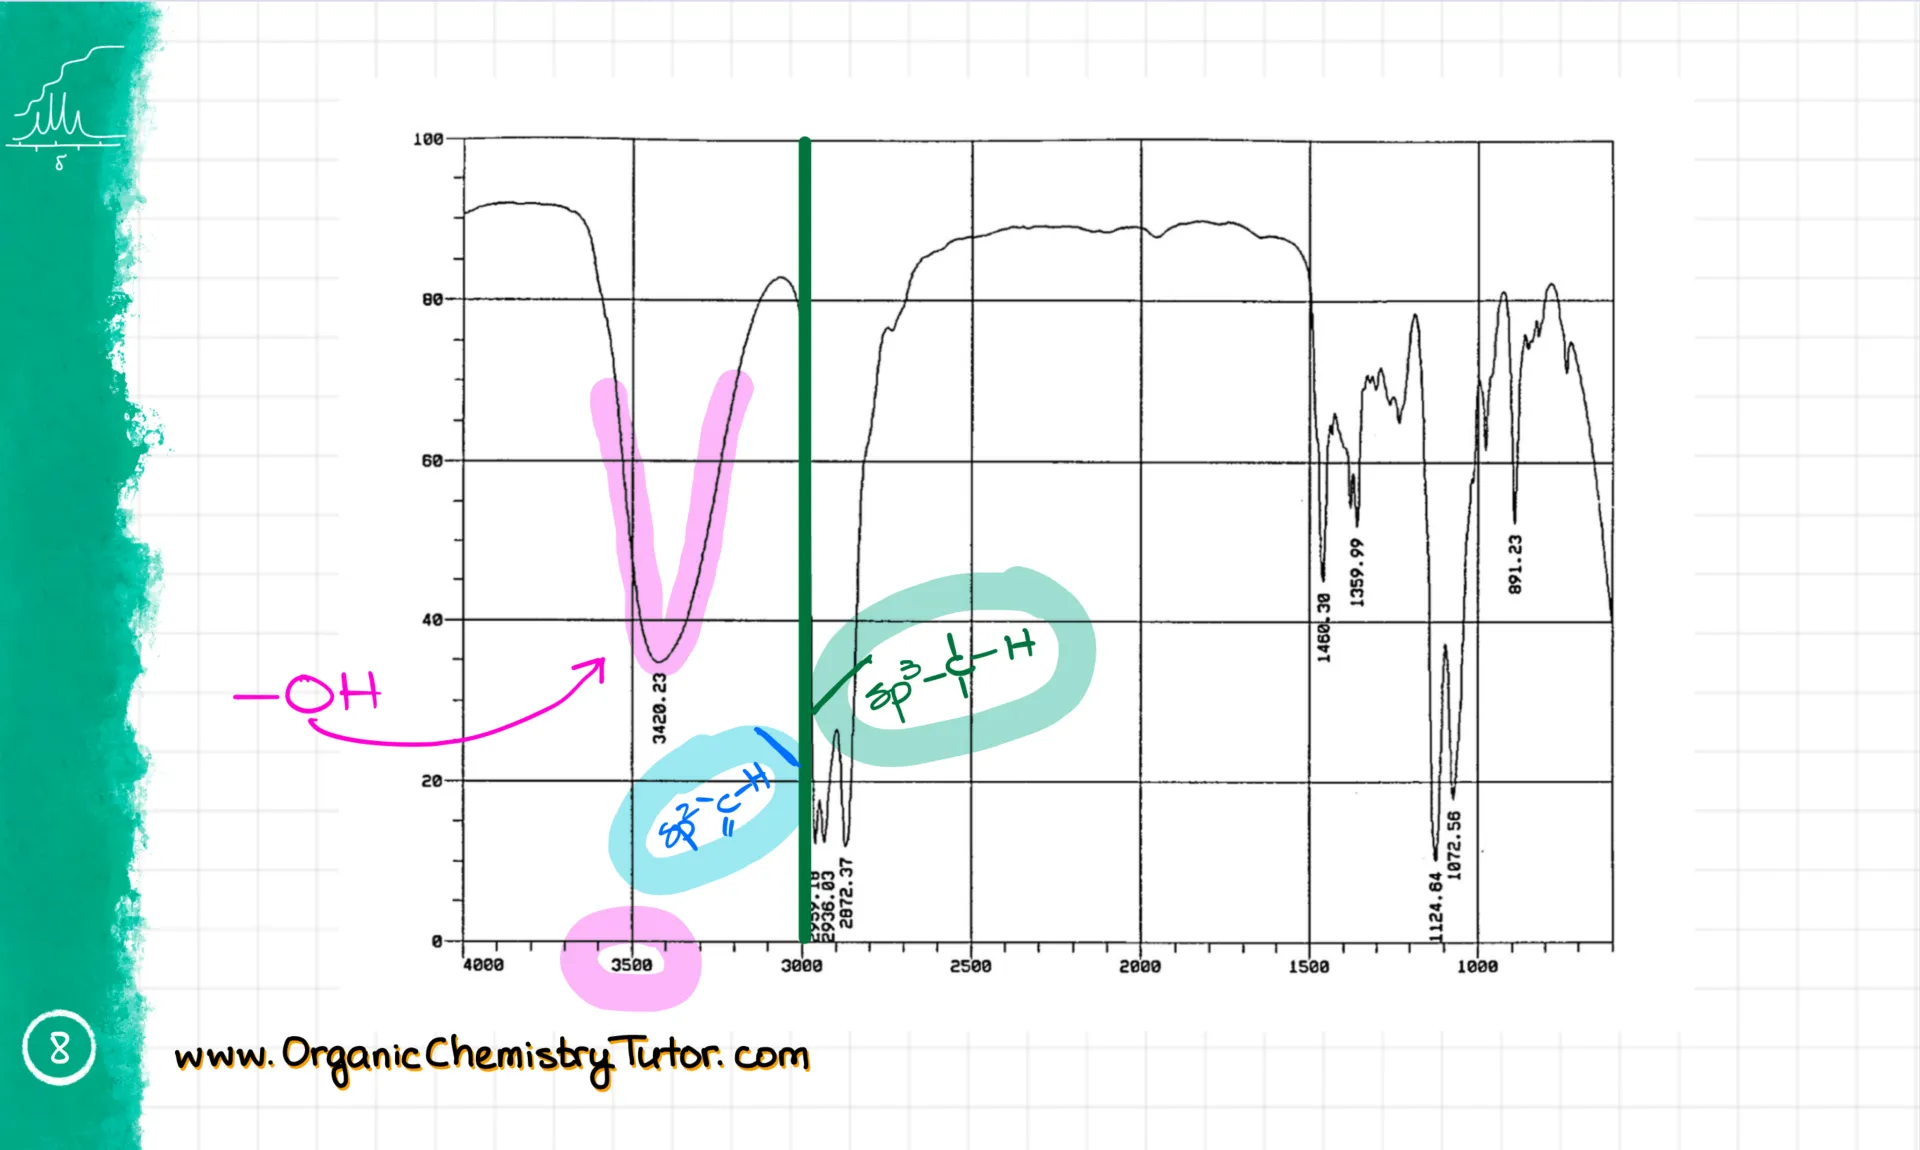
Then we hit the 3000 cm⁻¹ line. Signals just under 3000 cm⁻¹—around 2950—are the regular sp³-hybridized C-H stretches. You’ll see these in most compounds. Signals just above 3000 cm⁻¹—around 3050—are sp²-hybridized C-H stretches, which show up if your molecule has double bonds with hydrogens. This molecule doesn’t, so we’re not seeing them here.
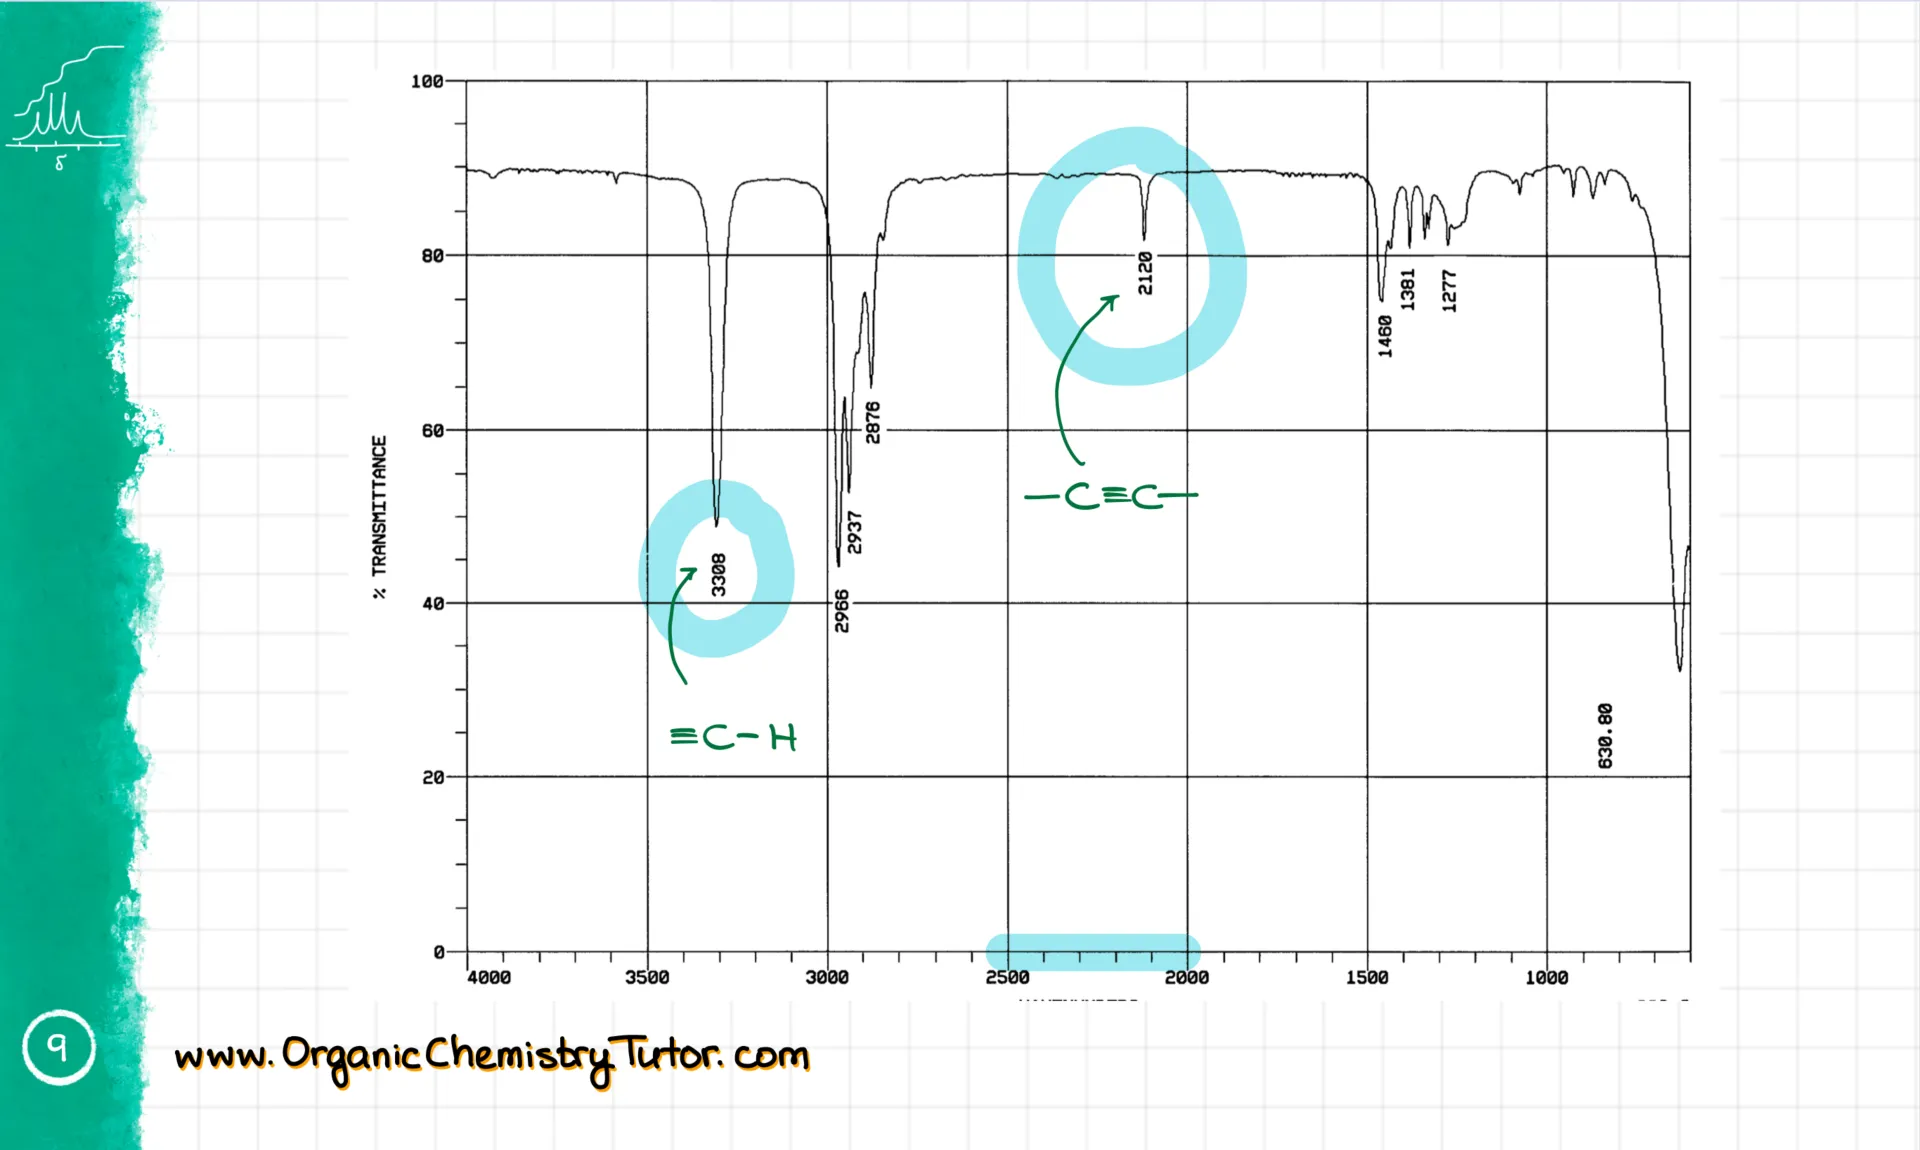
Next is the 2500–2000 cm⁻¹ range. That’s where triple bonds show up. These signals can be weak and sometimes even vanish. But if it’s a terminal triple bond, you’ll also see a sharp spike around 3300 cm⁻¹. That’s the sp-hybridized C-H stretch. It’s rare, but you should still know it.
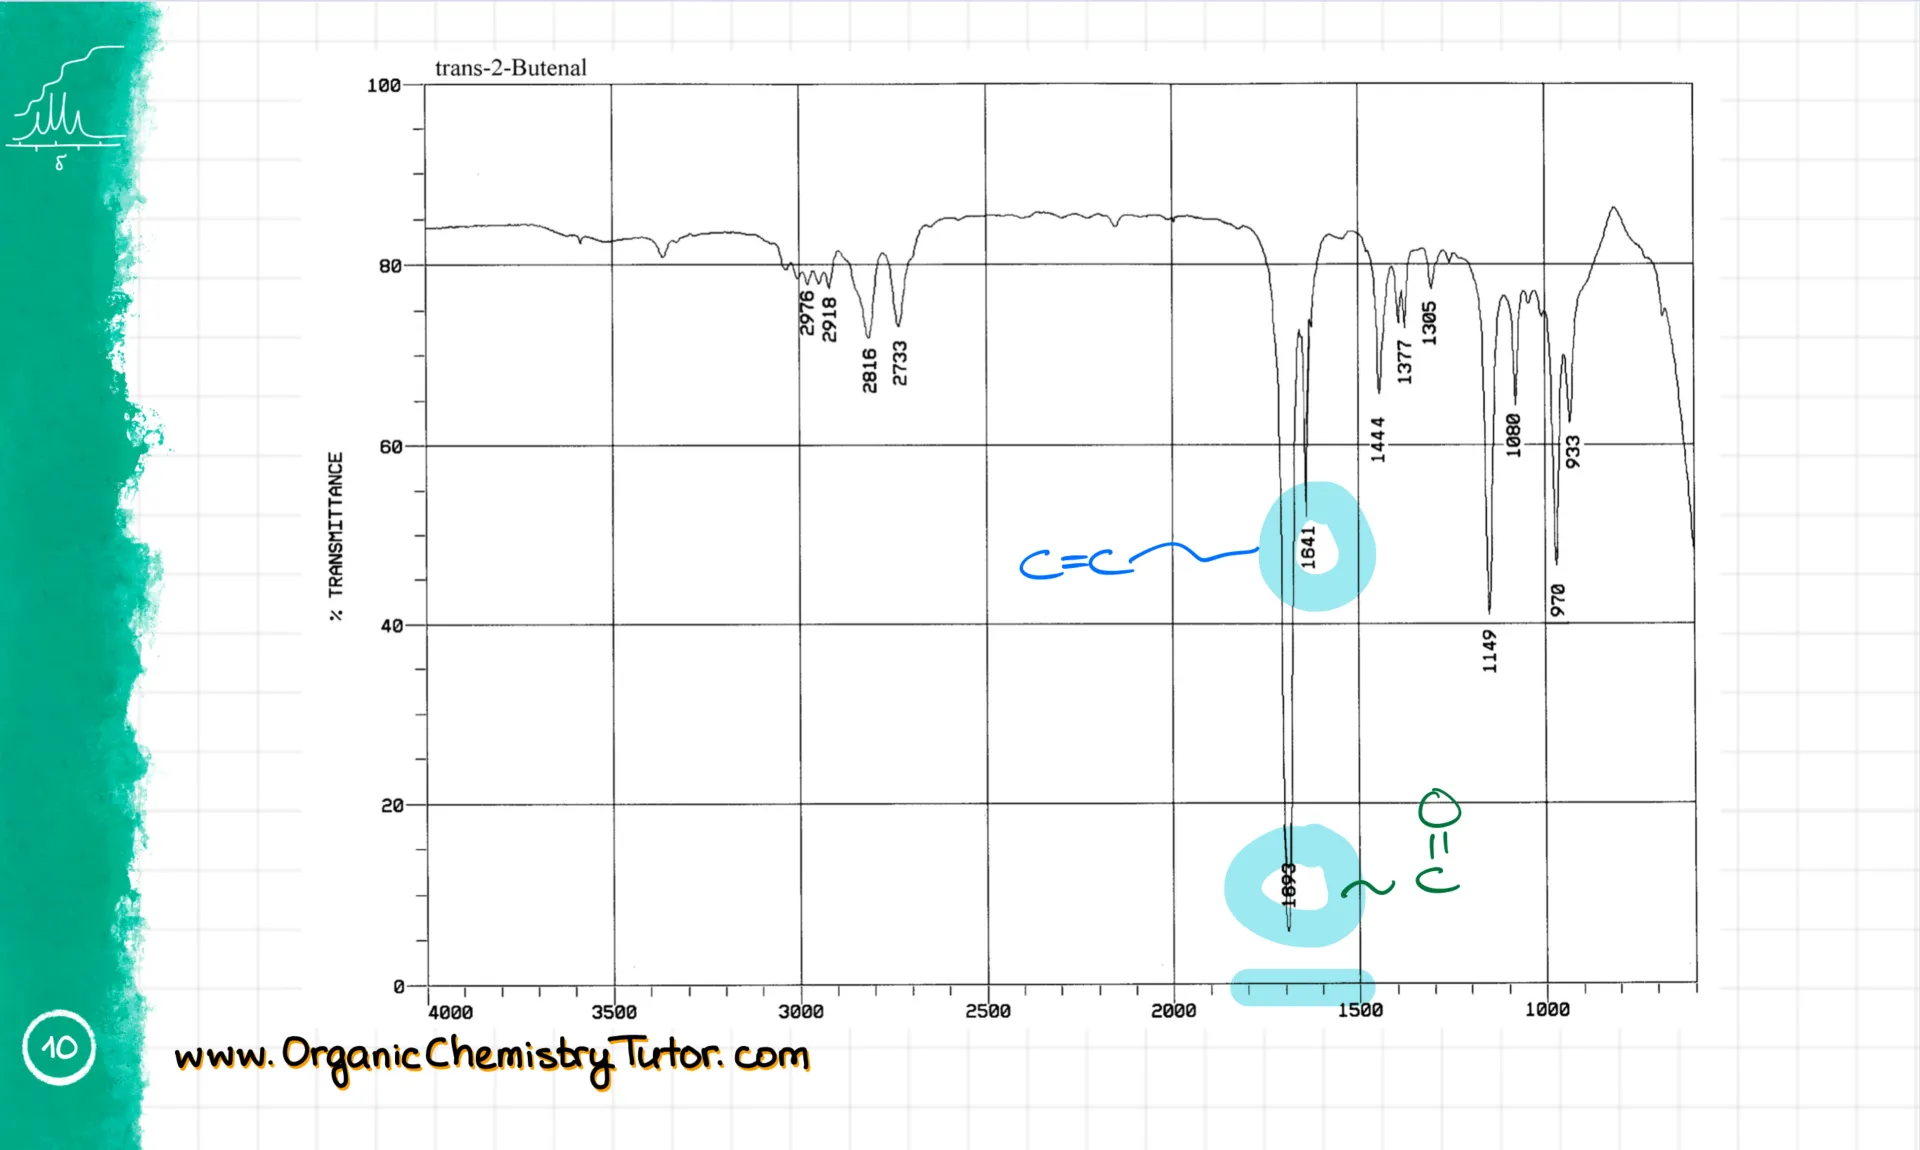
Now let’s move to the 1800–1500 cm⁻¹ region. This is the zone for various double bonds. For instance, we have a C=O stretch at roughly 1700 cm⁻¹ and a C=C bond around 1650 cm⁻¹. These are some of the most prominent functional groups you’ll need to spot in your molecules.
With time and practice, you’ll learn to recognize these functional groups and will naturally memorize most of these wavenumbers. Eventually, you’ll even start to recognize some signals in the fingerprint region. But don’t go poking around there until you’re solid with the analytical region above 1500 cm⁻¹.
Examples of IR spectra
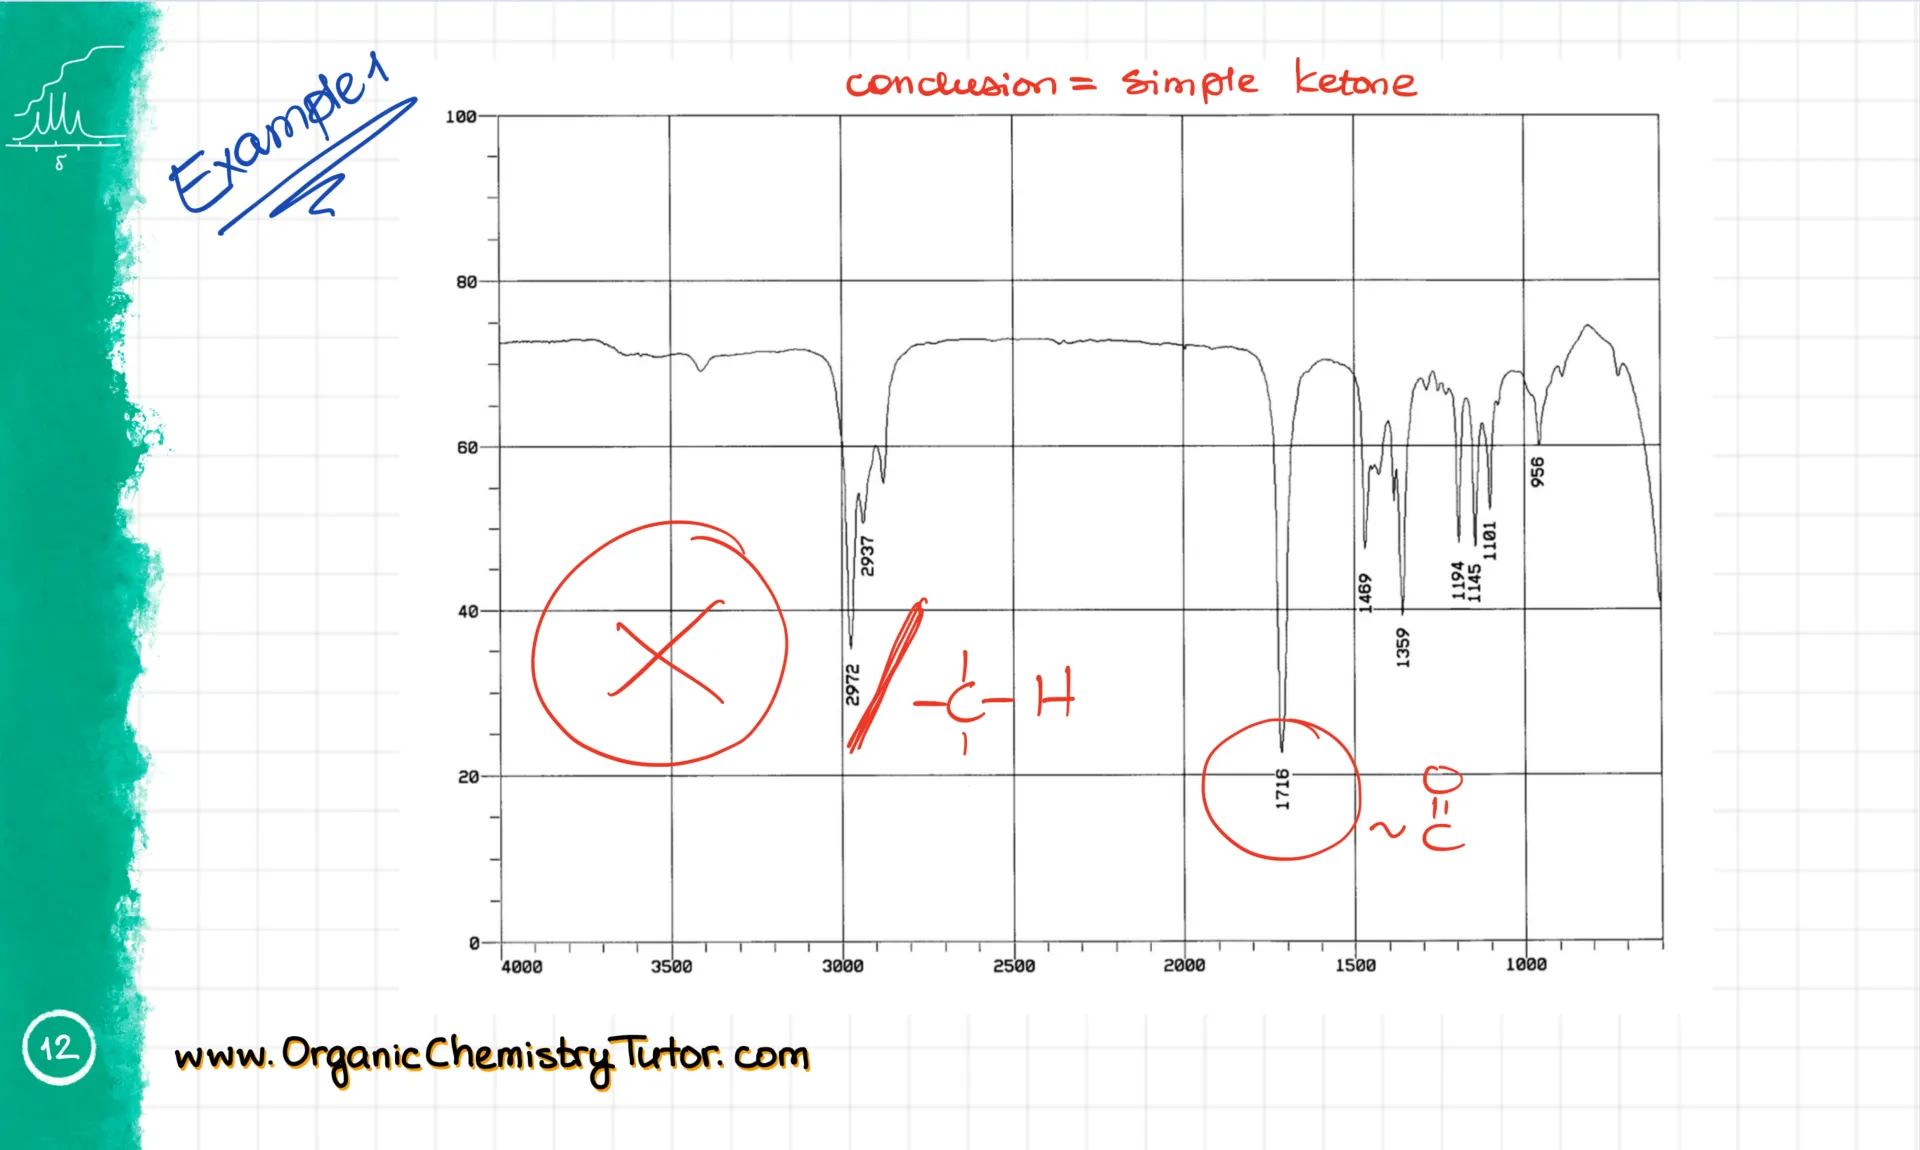
Alright, let’s look at a few examples. In this spectrum, I’m not seeing anything around 3500 cm⁻¹, so no -OH or -NH groups. I do see signals just under 3000 cm⁻¹, which are our sp³-hybridized C-H stretches. Then there’s a strong C=O stretch at around 1716 cm⁻¹. That tells me this is likely some kind of ketone. While the IR won’t give me the full structure, I can tell what functional groups are present. If I had HNMR or CNMR data, I could go further.
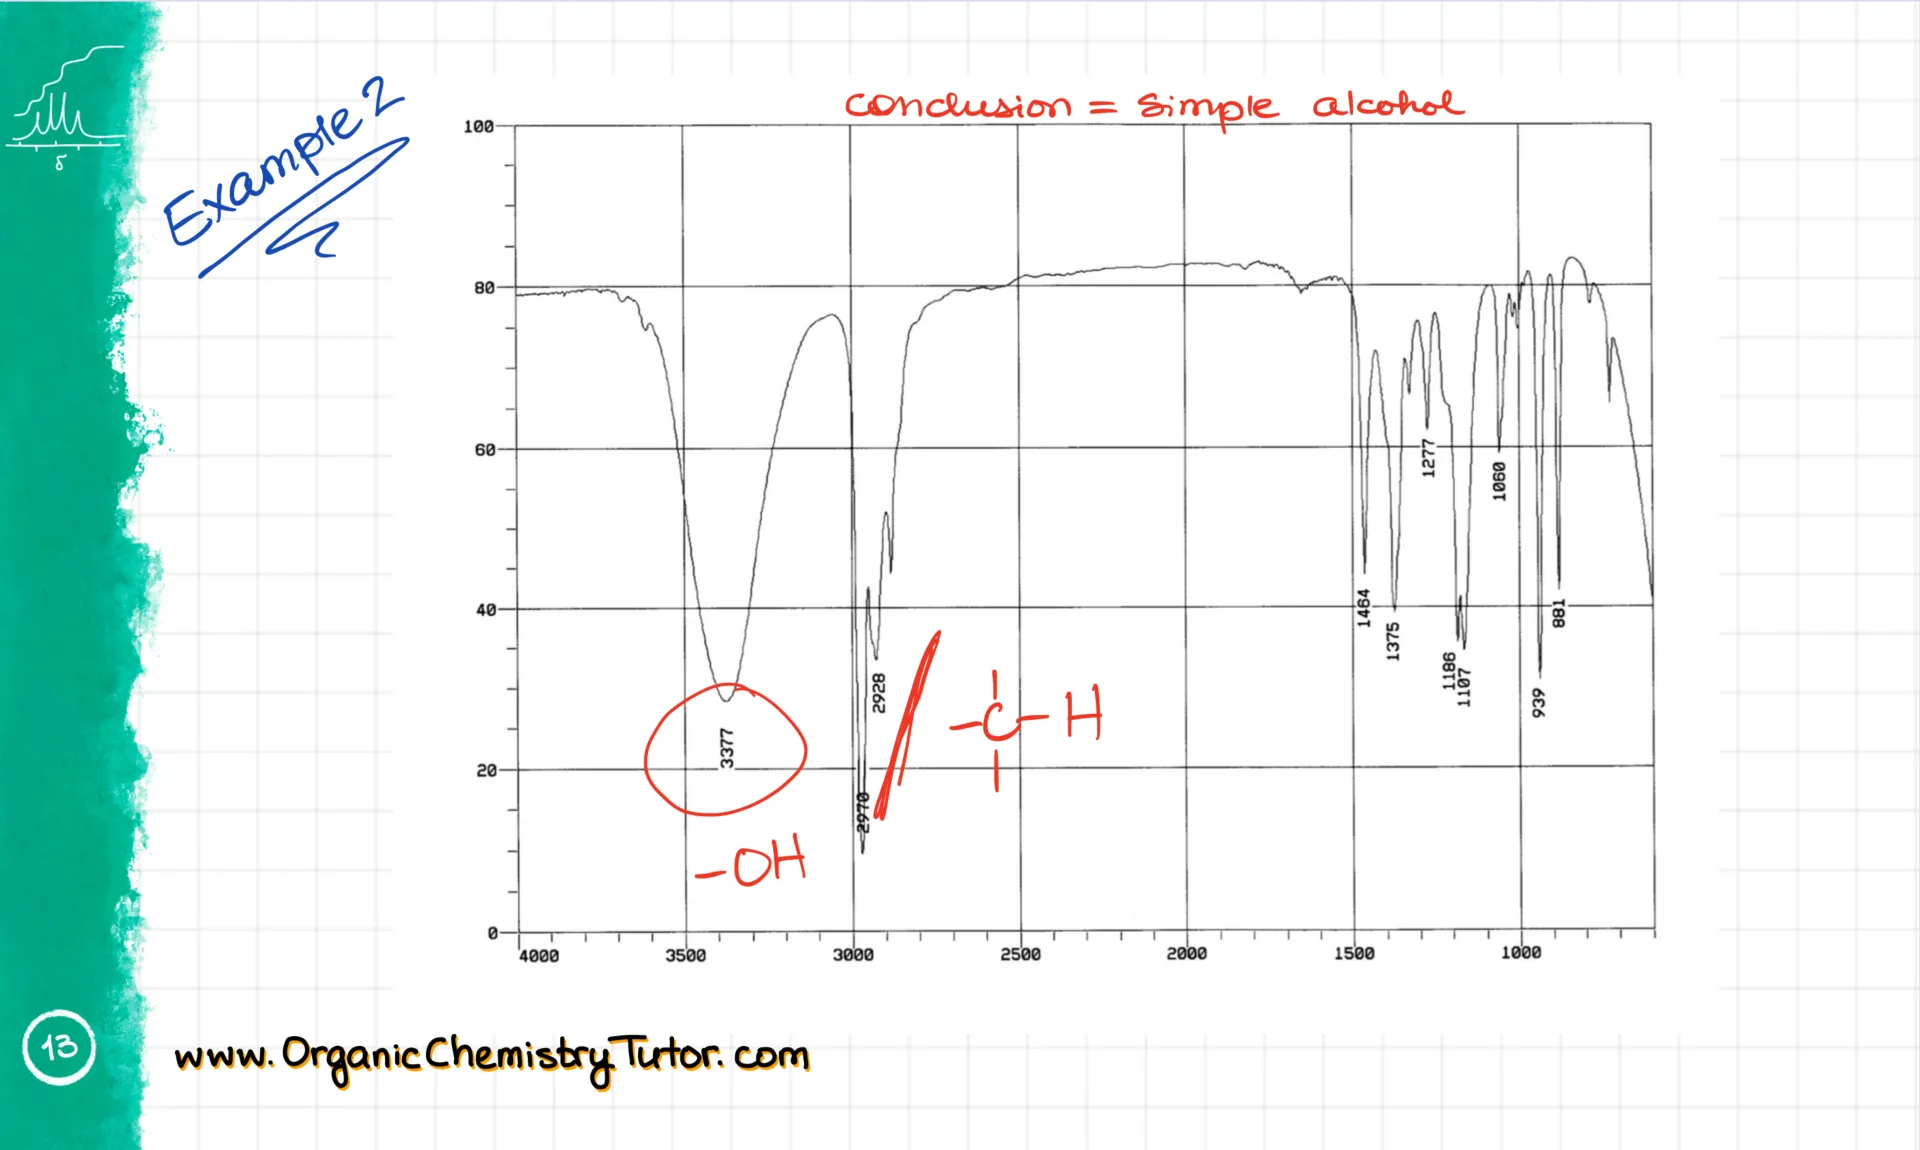
Now this next molecule shows a broad smooth signal between 3500 and 3300 cm⁻¹. That’s a clear sign of an alcohol. I also see some sp³ C-H stretches just under 3000 cm⁻¹, and not much else. So this is a simple alcohol.
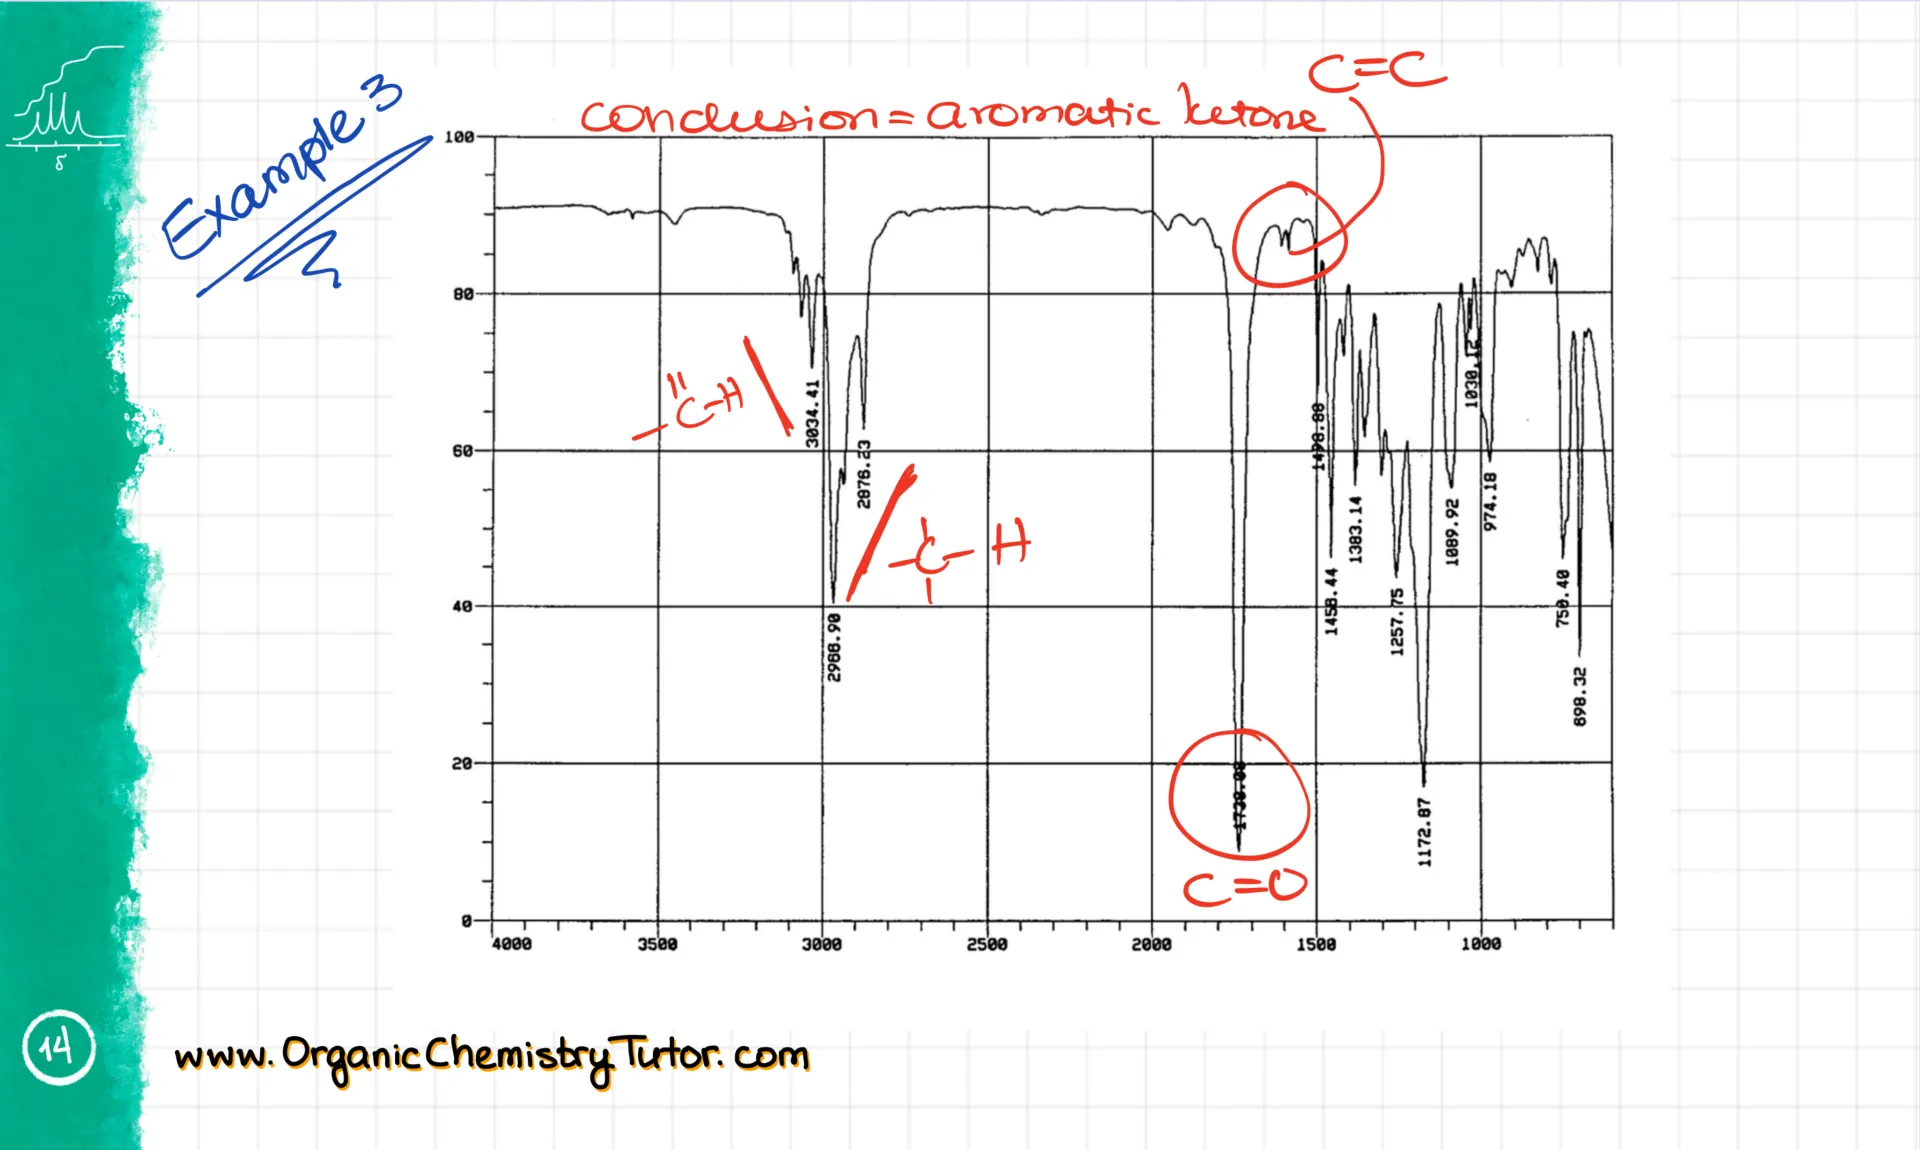
And here’s another example. I’m seeing signals from sp² C-H stretches, plus our usual sp³ ones. There’s also a carbonyl at 1730 cm⁻¹. And over here, a small signal for a C=C aromatic bond. Based on all this, I’d say it’s probably an aromatic ketone or some other kind of carbonyl. I can tell from the fingerprint region that this is actually an ester. But I wouldn’t expect a typical sophomore to be able to pull that out from the IR alone. Usually, IR is just your starting point, and you build the full structure by combining it with other techniques like NMR.
As I mentioned earlier, signals can look a bit different from one spectrum to another or one molecule to another. Solving spectroscopy questions is a bit of an art, and the only way to get good at it is through loads of practice.
Final thoughs
Alright folks, over the past few minutes, we’ve journeyed through the world of IR spectroscopy, decoding all those peaks and valleys. Now you know how to interpret wavenumbers, recognize signal shapes, and get a feel for their strength.
You’ve got your reference table and some solid tips on how to read an IR spectrum efficiently. But remember, it’s one thing to watch from the sidelines and a whole other thing to get in the game. Your learning will skyrocket only when you roll up your sleeves and start solving real problems.
Starting today, I challenge you to solve at least two or three spectroscopy questions every day until your final. You’ll stumble. You’ll scratch your head. But eventually, you’ll conquer it. By the time your test rolls around, you’ll handle IR questions like a pro—mark my words!