Introduction to NMR
Imagine being placed inside an MRI machine. But instead of you, it’s a molecule. And instead of the MRI machine, it’s an NMR instrument. Just like MRI gives us a clear picture of what’s happening inside the human body, NMR tells us what kind of molecule we’re looking at.
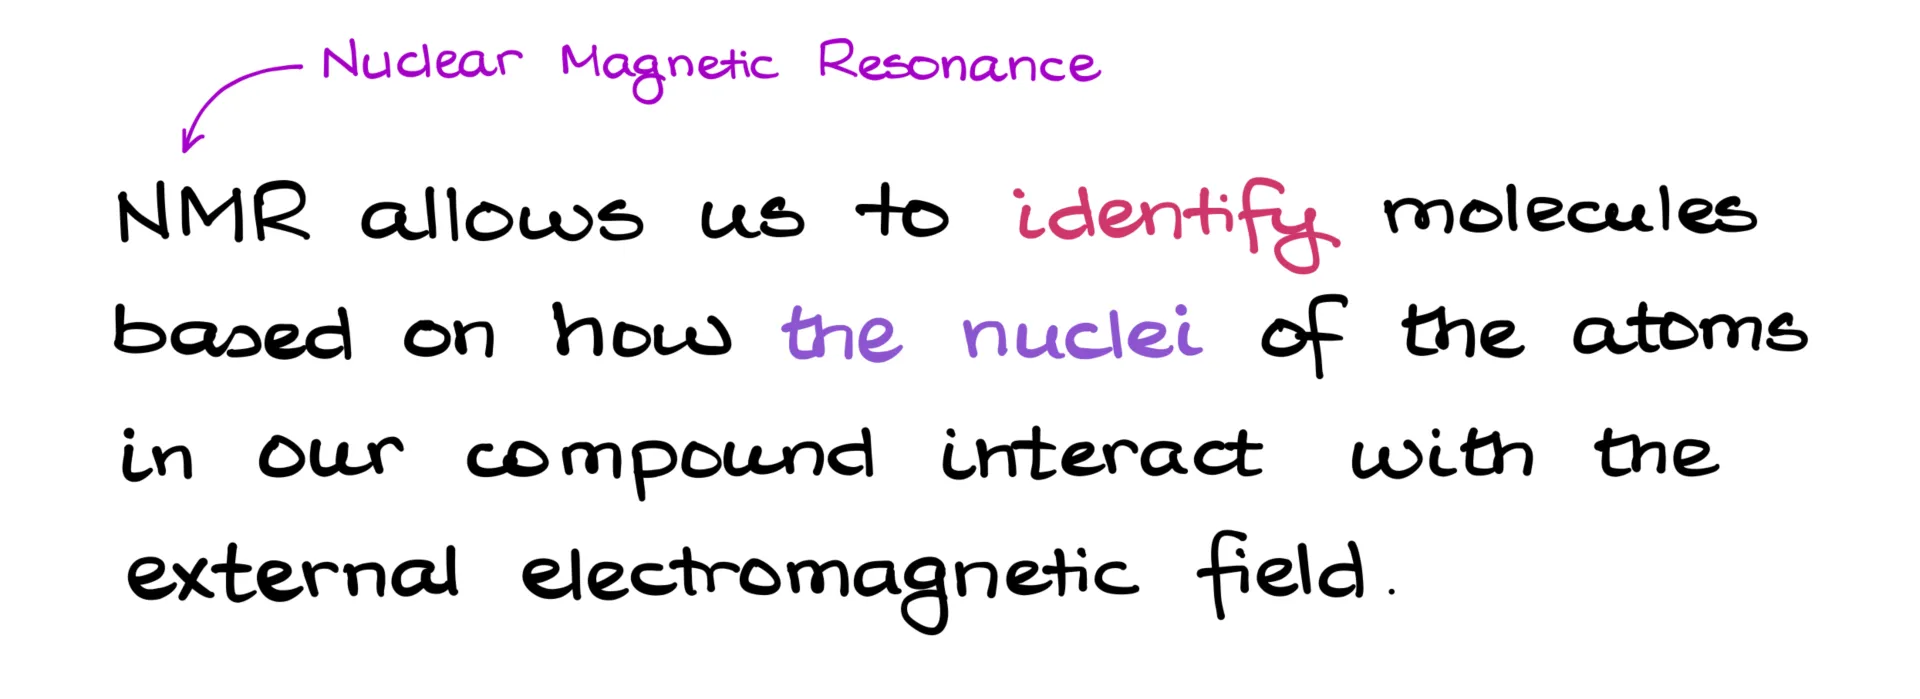
In other words, NMR lets us identify molecules based on how the nuclei of atoms in our compound interact with an external electromagnetic field. And since this technique looks at how nuclei interact with a magnetic field, it’s called Nuclear Magnetic Resonance—or NMR for short.
In this tutorial, we’ll dive into NMR and see how we use it in organic chemistry to identify molecules.
What does NMR “see” in a molecule?
So, what exactly does the NMR see? In short, it detects nuclei with odd mass numbers. While there are quite a few nuclei like that, organic chemists usually focus on just a handful: ¹H, ¹³C, ¹⁵N, ¹⁹F, and ³¹P. Out of these, hydrogen and carbon are our core players in NMR spectroscopy. The others are specialty cases we won’t worry about in a standard organic chemistry course.
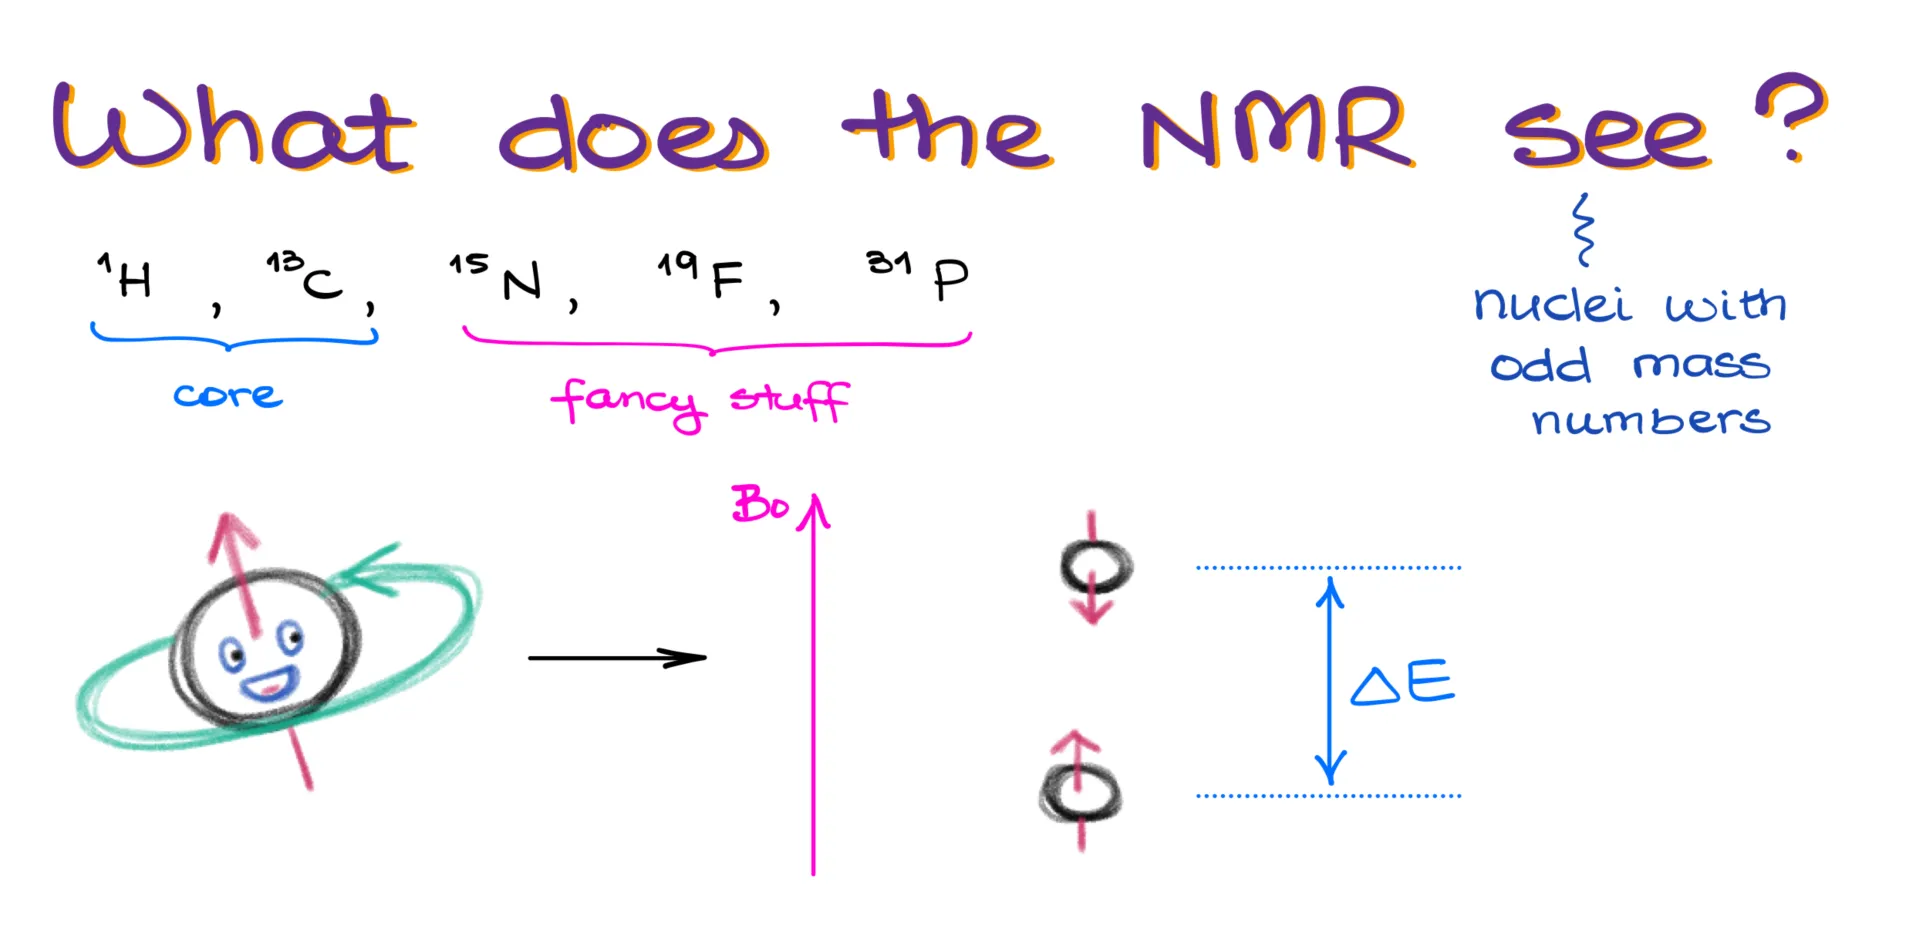
Without diving too deep into quantum mechanics, here’s the gist: a nucleus with an odd mass number can align its spin either with or against an external magnetic field. It takes more energy to flip the spin against the field than to align with it. What the NMR instrument does is measure the energy needed to flip the spin—and that energy depends on the chemical environment of the nucleus.
In this tutorial, we’ll focus on ¹H NMR and ¹³C NMR, as these are the two core techniques used to determine molecular structures.
Carbon NMR (CNMR)
We’ll start with ¹³C NMR. Since ¹³C NMR detects carbon atoms in a molecule, let’s look at a simple example: acetone. This molecule has three carbon atoms. From the NMR’s perspective, the two outer methyl carbons are chemically equivalent—they’re both CH₃ groups and both attached to the same carbonyl carbon. Because of this, they appear as a single signal on the NMR spectrum. The carbon in the middle, however, is different. It’s directly bonded to an oxygen, so it’s in a different environment.
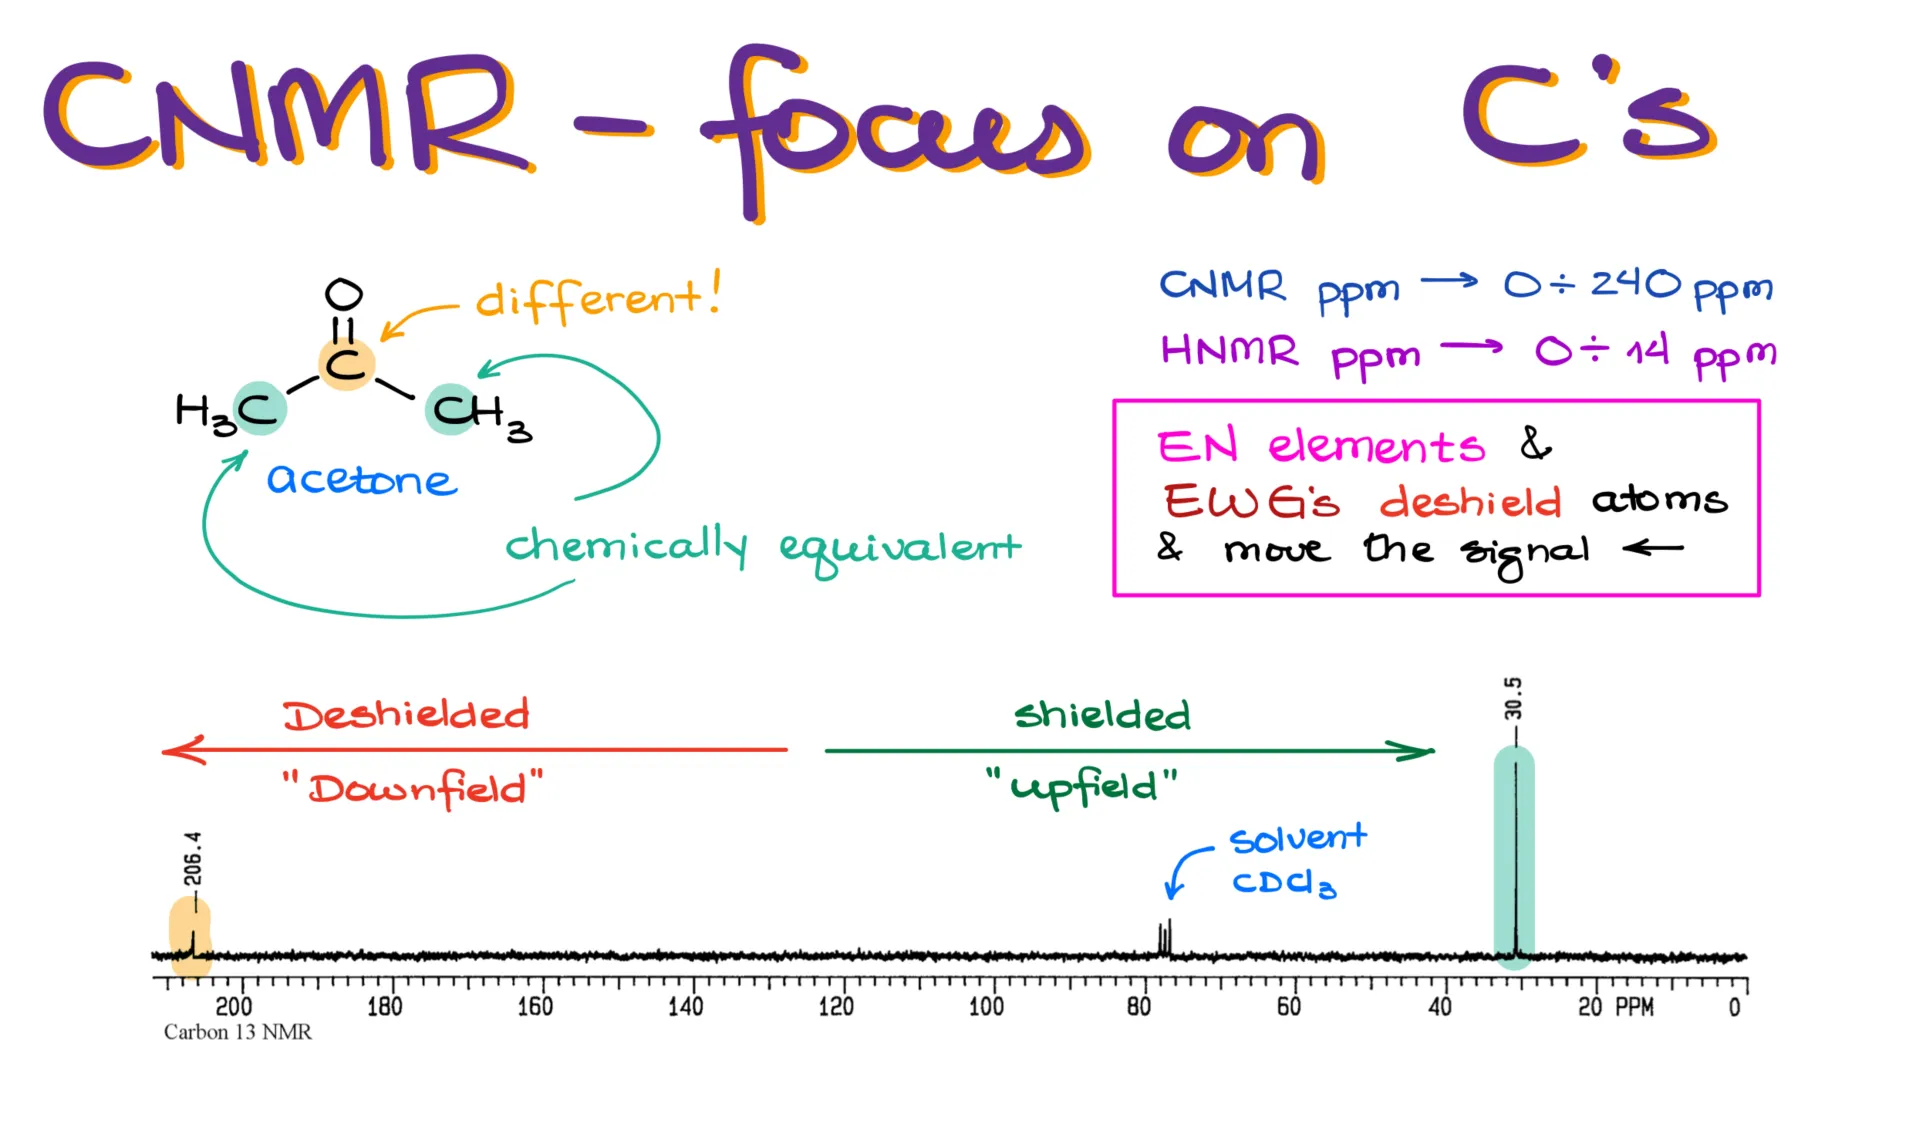
Looking at the spectrum for acetone, we see two main signals. One is at 206 ppm, and the other is at 30 ppm. There’s also a smaller signal at around 77 ppm—this comes from chloroform, which is commonly used as the NMR solvent. You’ll see this signal often, and you can ignore it when analyzing your own data.
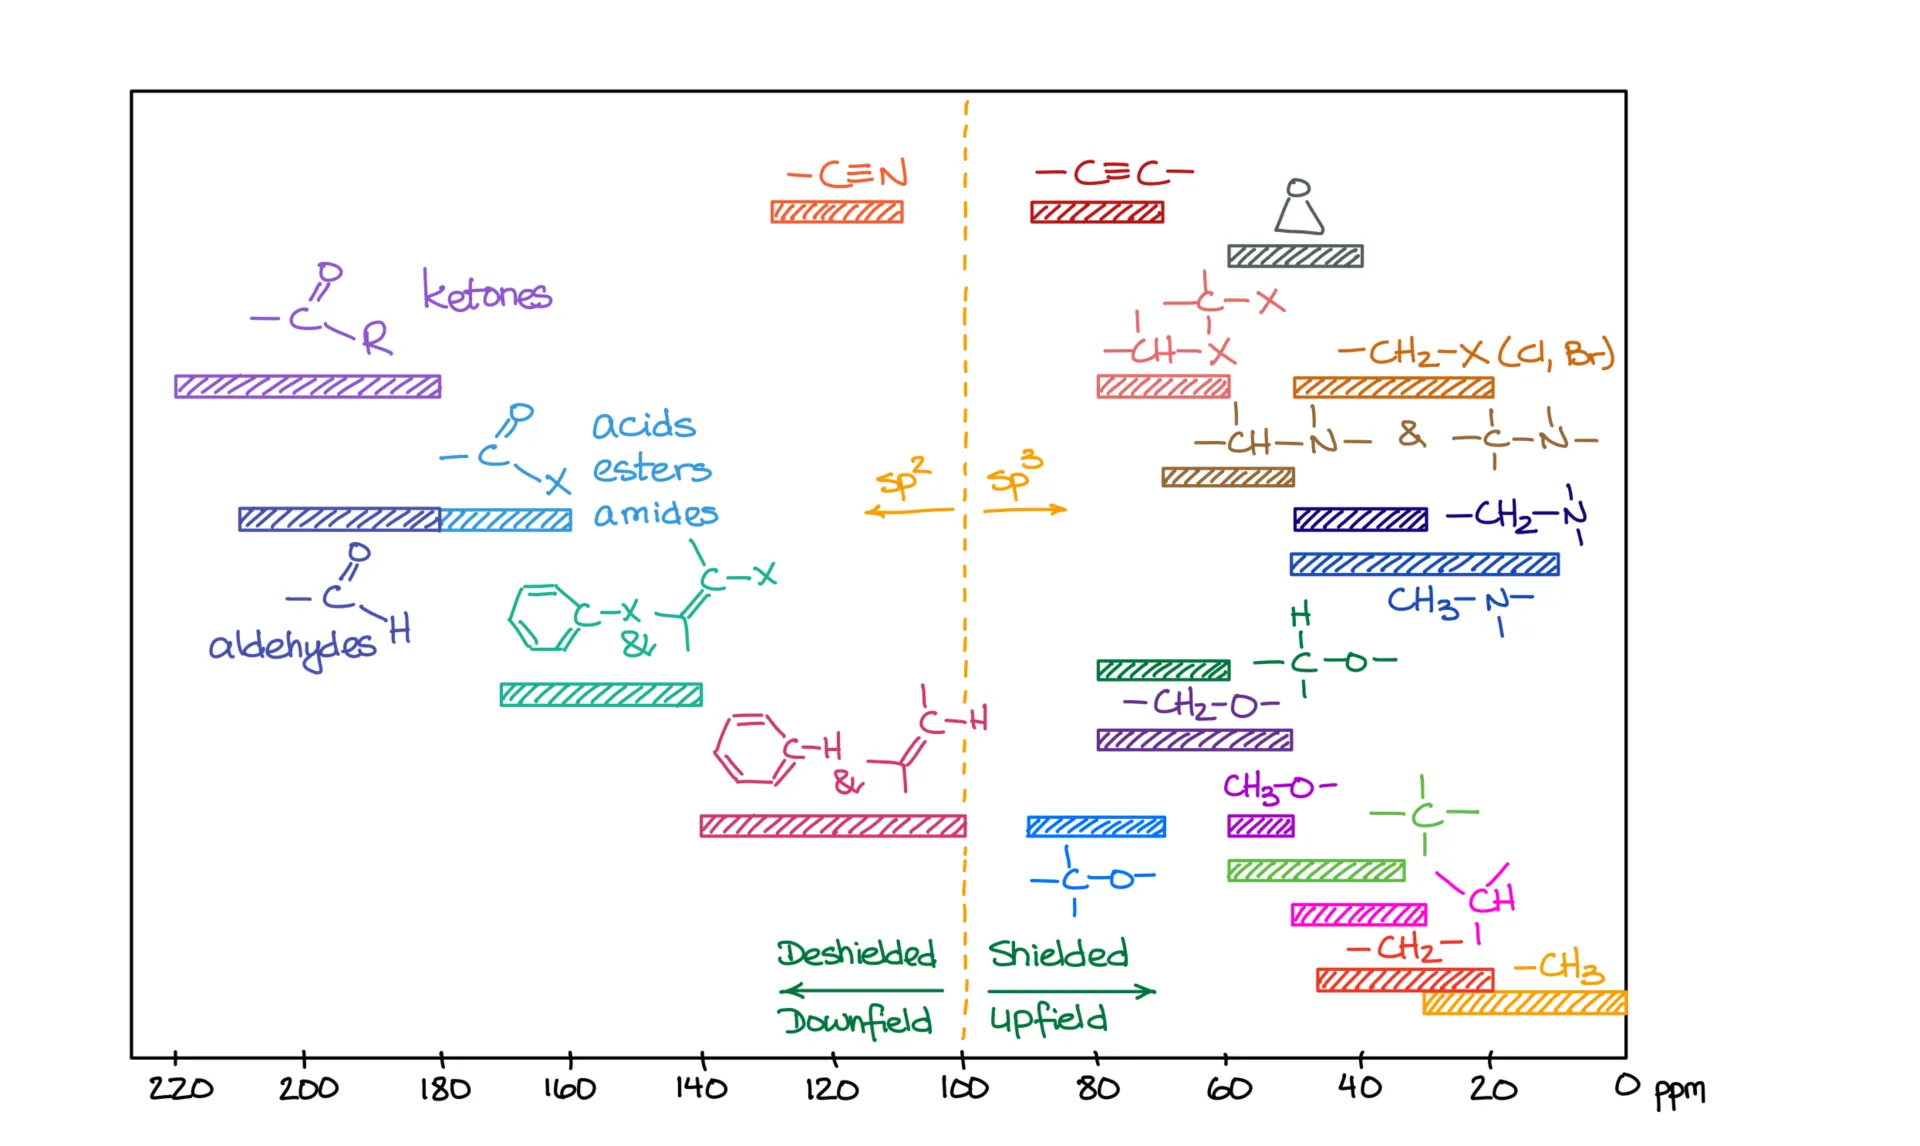
Now, NMR uses the ppm (parts per million) scale. This is standardized and doesn’t depend on the specific instrument being used. For ¹³C NMR, the typical range is from 0 to about 240 ppm. For ¹H NMR, it’s from 0 to about 14 ppm. If your instructor doesn’t label which spectrum you’re looking at, you can usually tell by checking the x-axis range.
In NMR, signals on the left side of the spectrum are deshielded, which we call “downfield,” while signals on the right are shielded, which we call “upfield.” Electronegative atoms and electron-withdrawing groups deshield the atoms they’re bonded to, pushing their signals to the left. That’s why the carbon next to oxygen in acetone shows up at 206 ppm—it’s being pulled downfield by the electronegative oxygen.
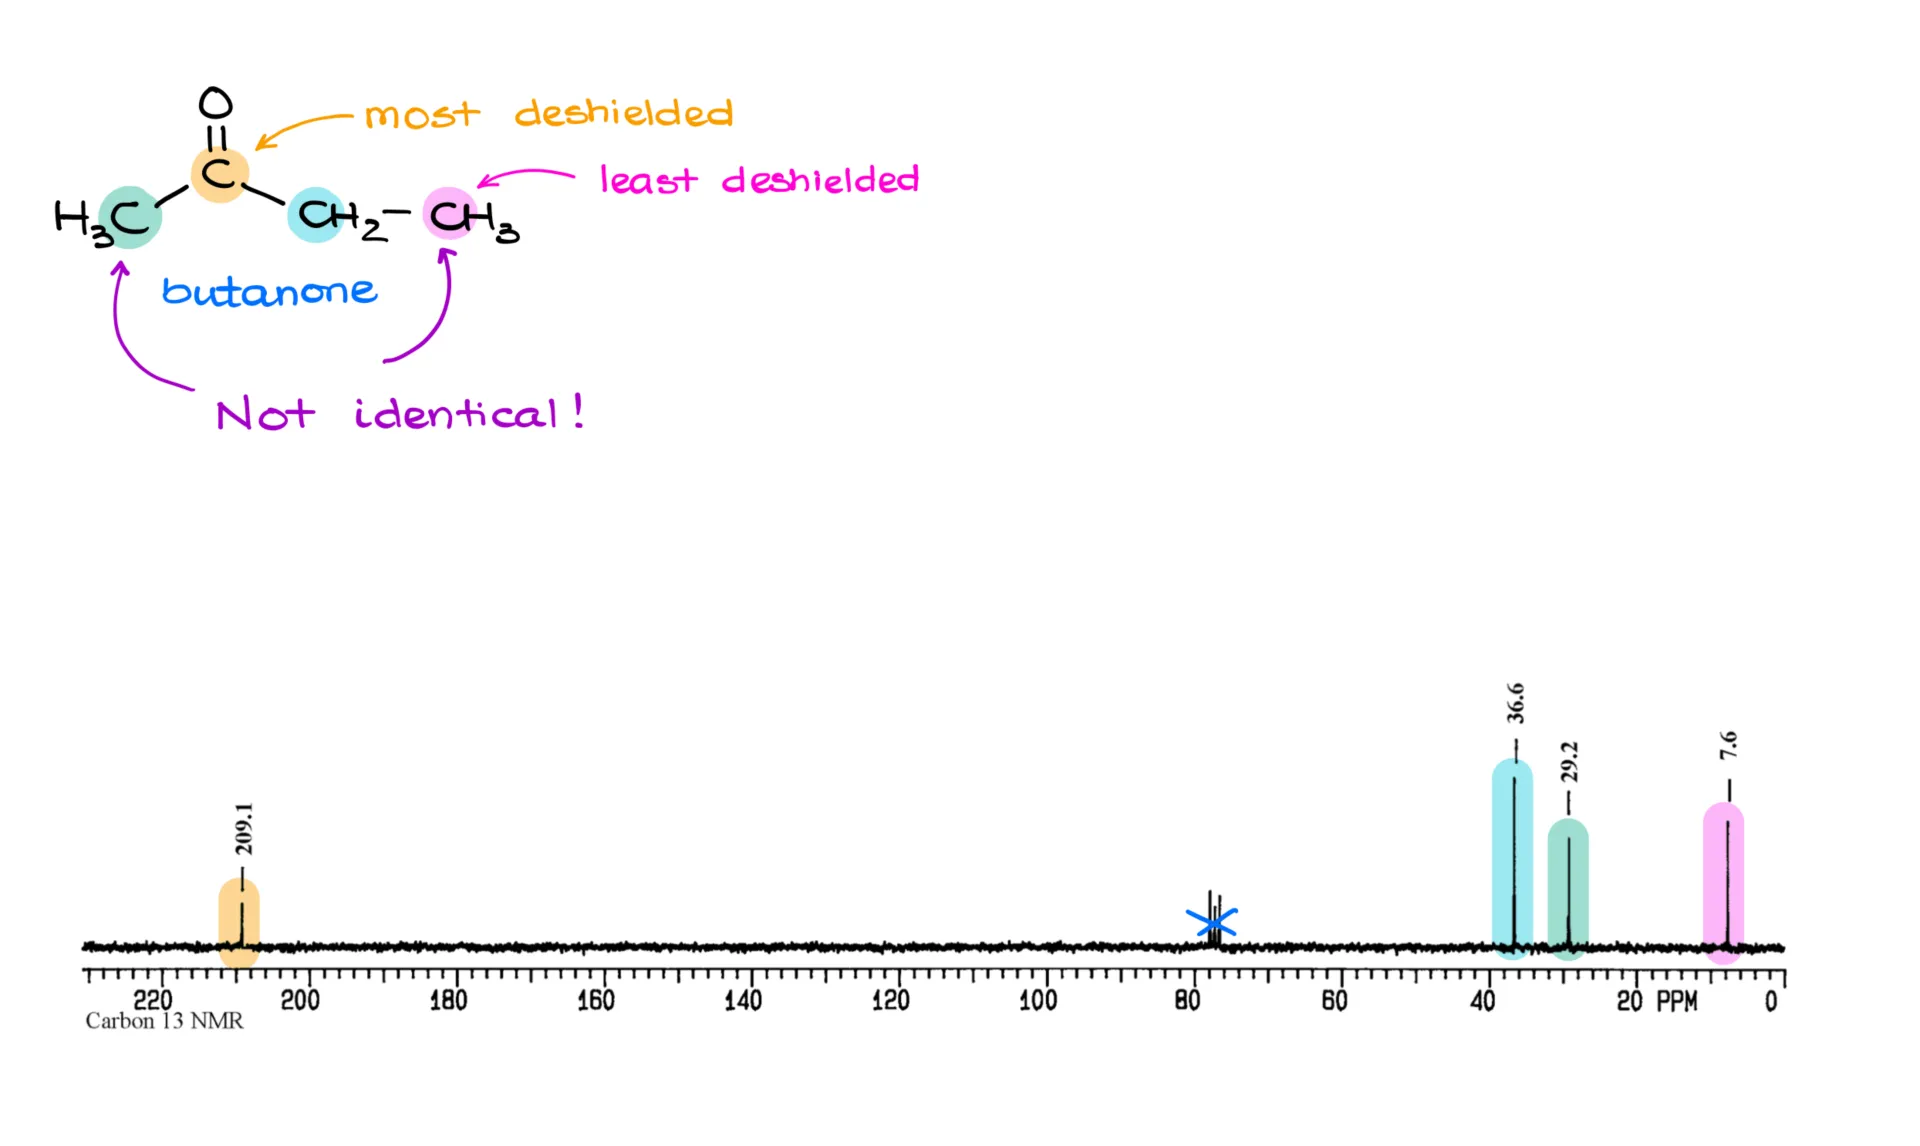
Let’s look at another example: butanone. In its spectrum, the carbonyl carbon shows up at 209 ppm. The CH₂ group is at 36 ppm. One of the methyl groups appears at 29 ppm, and the other shows up at just 7 ppm. You might be wondering why these two CH₃ groups aren’t equivalent like in acetone. The answer lies in connectivity. The green methyl group is bonded directly to the carbonyl, while the pink one is connected to a CH₂ group instead. Because they have different environments, they are not chemically equivalent. Always look closely at how atoms and groups are connected in a molecule—differences in connectivity mean differences in NMR signals.
When it comes to predicting signal positions, don’t just guess. Use your ¹³C NMR reference table. I’m not suggesting you memorize the whole thing—you’ll only get confused. Keep it nearby and refer to it while practicing. With enough exposure, you’ll memorize the most common values naturally.
Proton NMR (HNMR)
Now let’s move on to ¹H NMR. This technique shares similarities with ¹³C NMR, but adds a few more layers of detail that help us determine molecular structure even more precisely.
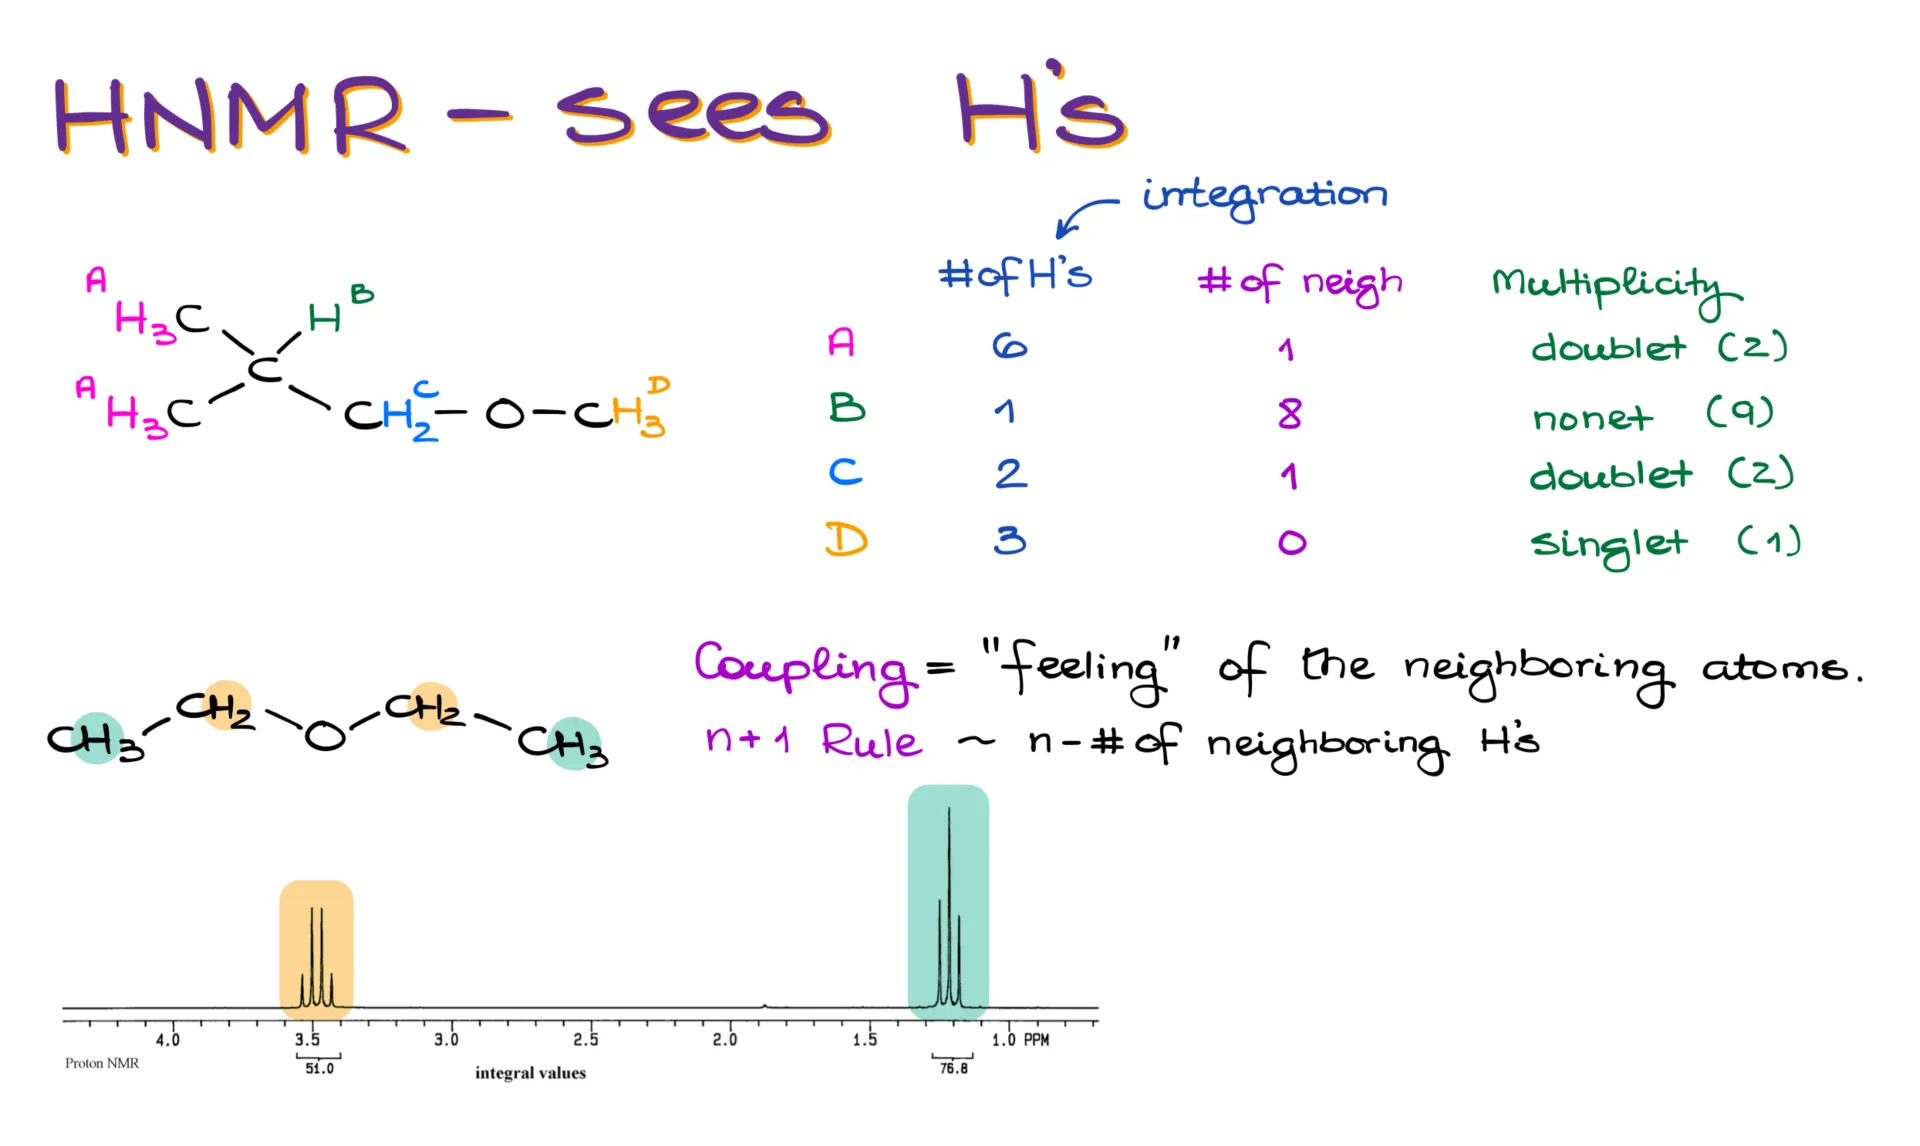
Take this molecule, for example. Just like with carbon, we start by identifying equivalent hydrogen groups. These pink hydrogens are equivalent because they’re bonded to the same carbon—let’s call them group A. With hydrogen, we usually have more of them than carbons, so it’s common for each group to have multiple hydrogens. In group A, we have six hydrogens.
Group B has one hydrogen. Group C has two. Group D has three. Notice that even though groups A and D are both methyl groups, they are not equivalent due to their different connections in the molecule.
The number of hydrogens in each group is referred to as “integration.” It’s called that because in ¹H NMR, we literally integrate the area under the signal’s curve to find how many hydrogens are represented by that peak. It’s one of the handiest features of proton NMR.
Another feature that sets ¹H NMR apart from ¹³C NMR is splitting—also called multiplicity or coupling. This tells us how many neighboring hydrogens each group has. To find the number of peaks in each signal, we use the simple “n+1” rule.
Let’s look at the neighbors for each group. Group A has one neighbor—group B. Group B sees both A and C, giving it a total of eight neighbors. Group C only sees B, so it has one neighbor. Group D doesn’t have any neighbors.
Using the n+1 rule, we find the splitting patterns: group A is a doublet, group B is a nonet, group C is a doublet, and group D is a singlet.
Here’s what that looks like on an actual spectrum for diethyl ether. Each CH₂ group sees three hydrogens from the methyl groups, resulting in a quartet. Each methyl group sees two hydrogens from the CH₂ groups, giving a triplet.
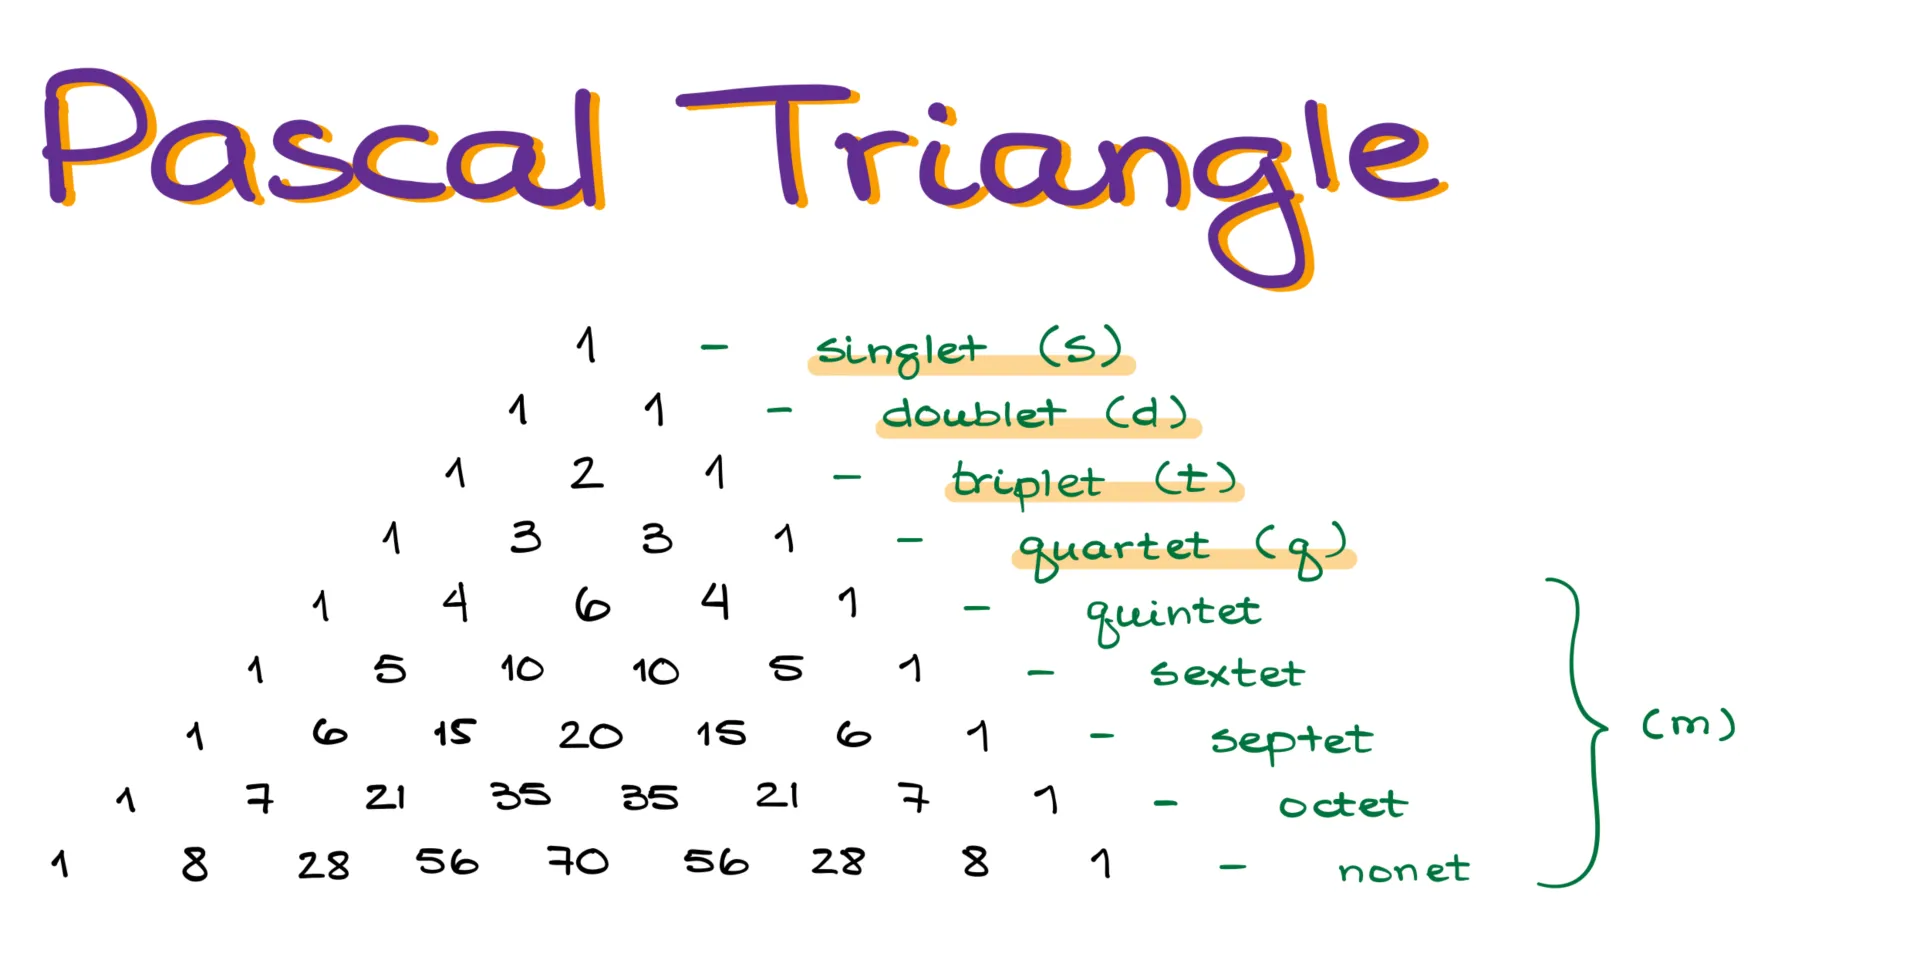
One interesting detail about splitting is that the peaks within a multiplet aren’t all the same height. You can estimate their relative intensities using Pascal’s triangle—a simple math trick where each number is the sum of the two above it. For example, a singlet has one peak, a doublet has two of equal height, a triplet has a middle peak that’s twice the height of the outer ones, and a quartet’s two inner peaks are three times as tall as the outer peaks. This continues with quintets, sextets, septets, octets, and nonets. The first four—singlet, doublet, triplet, and quartet—are the most common and usually abbreviated with a single letter. Anything more complex is often just labeled as a multiplet.
Keep in mind that the intensity of inner peaks increases so much that in real spectra, the outer peaks might be too weak to see. A nonet might actually look like a septet because the edges fade into the baseline.
Splitting in -OH and -NH groups
Also worth noting: groups capable of hydrogen bonding—like -OH and -NH—typically don’t couple with neighbors or from neighbors. Take ethanol, for example. The methyl group sees the CH₂ and appears as a triplet. The CH₂ group sees the methyl, but not the -OH, so it shows up as a quartet. And the -OH group? It doesn’t see anything—just a singlet.
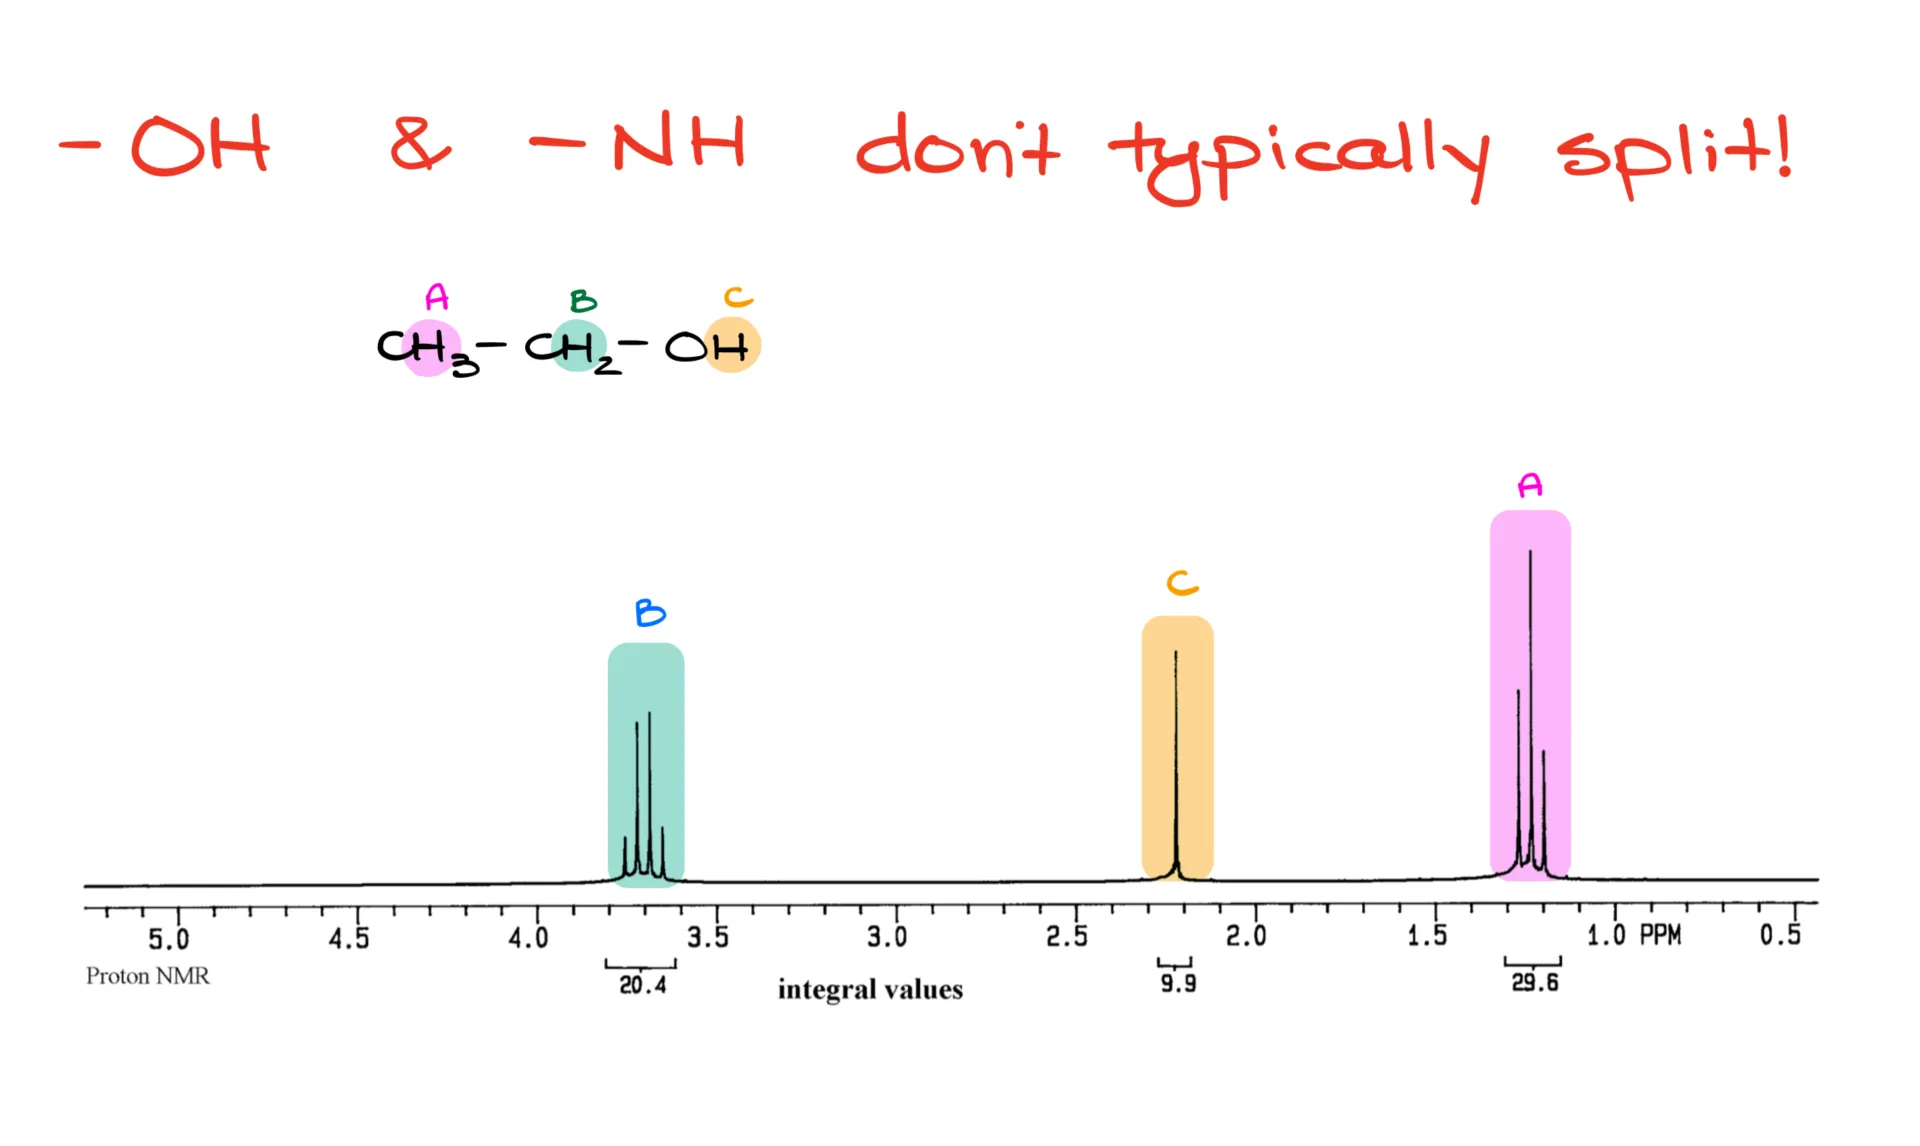
These groups can also appear at different places in the spectrum depending on factors like concentration, solvent, and impurities. They’re a bit unpredictable—drifters on the spectrum.
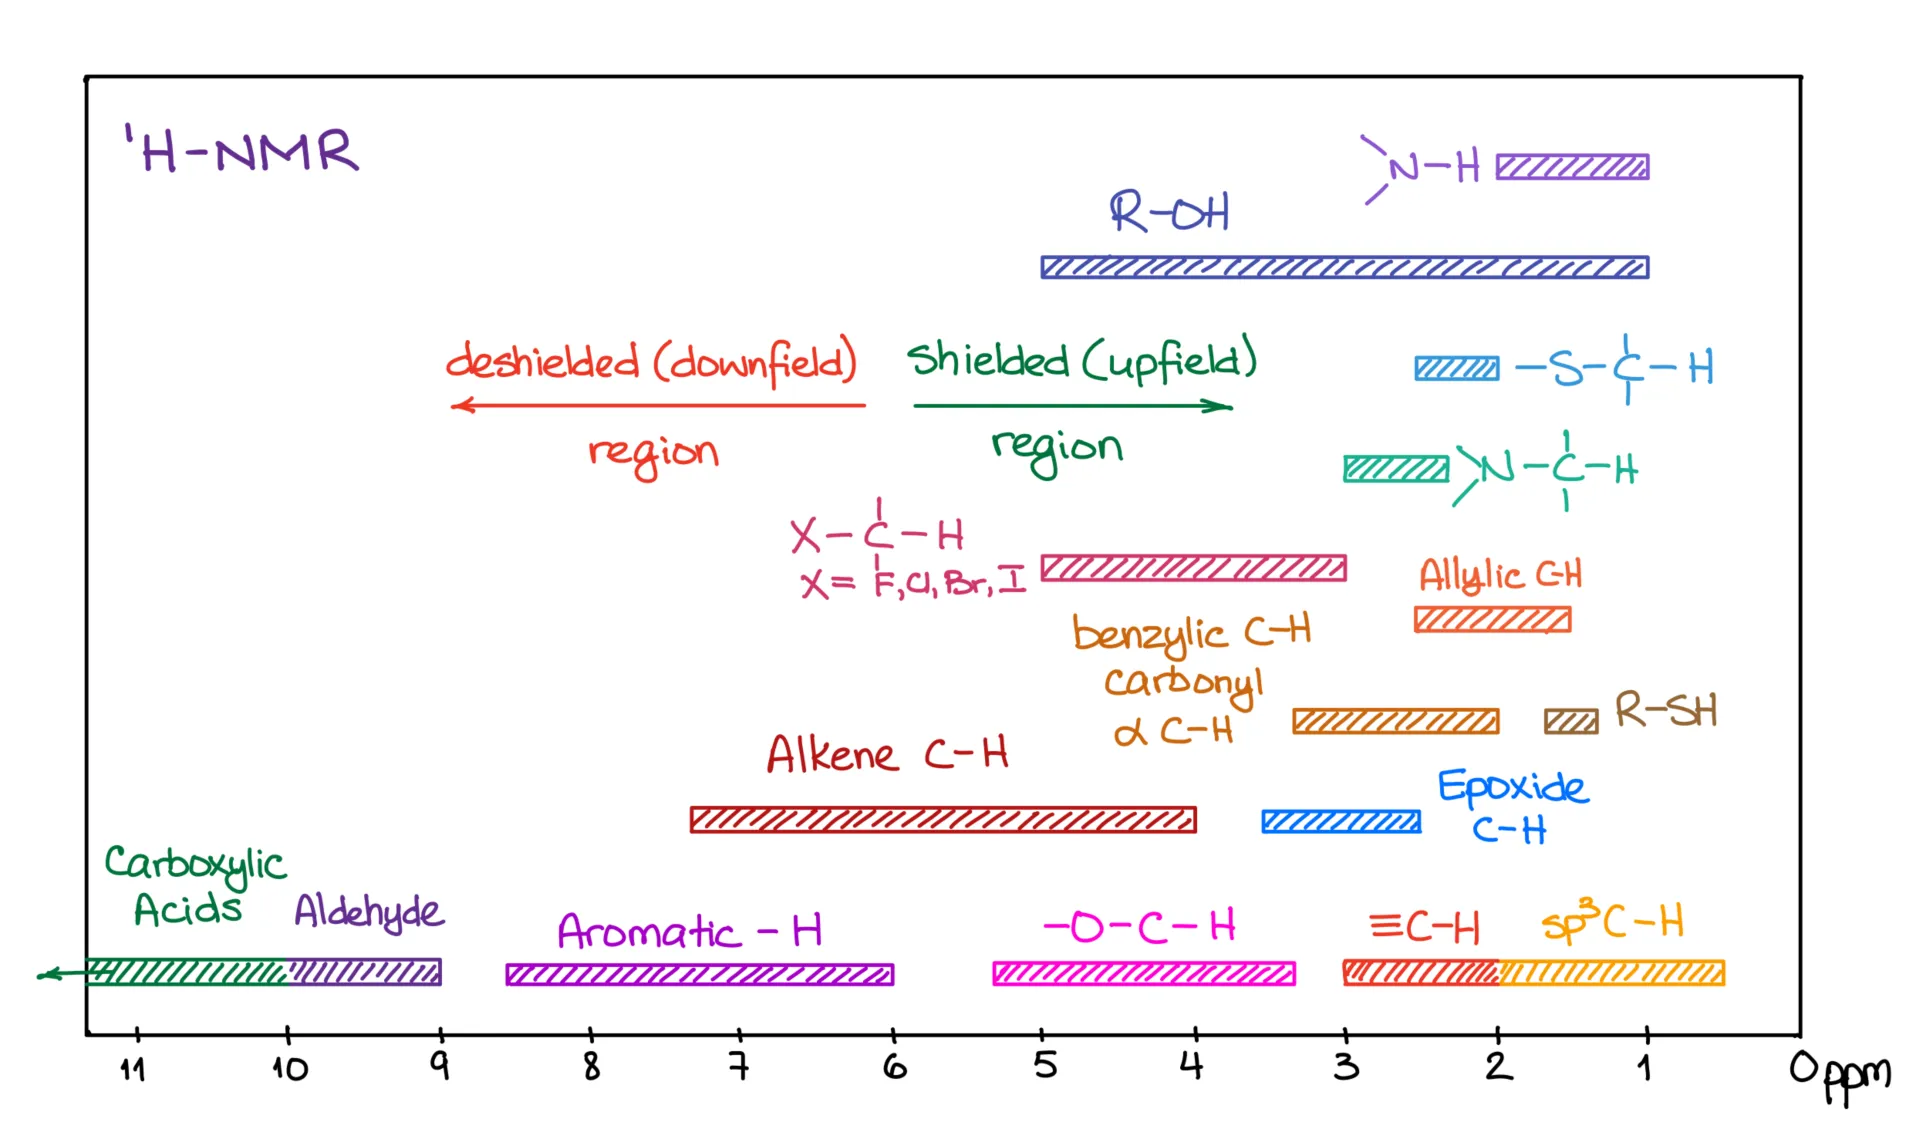
Speaking of signal positions, or chemical shifts, you should definitely have a reference table for ¹H NMR, just like you do for ¹³C NMR.
Recap
So, let’s recap.
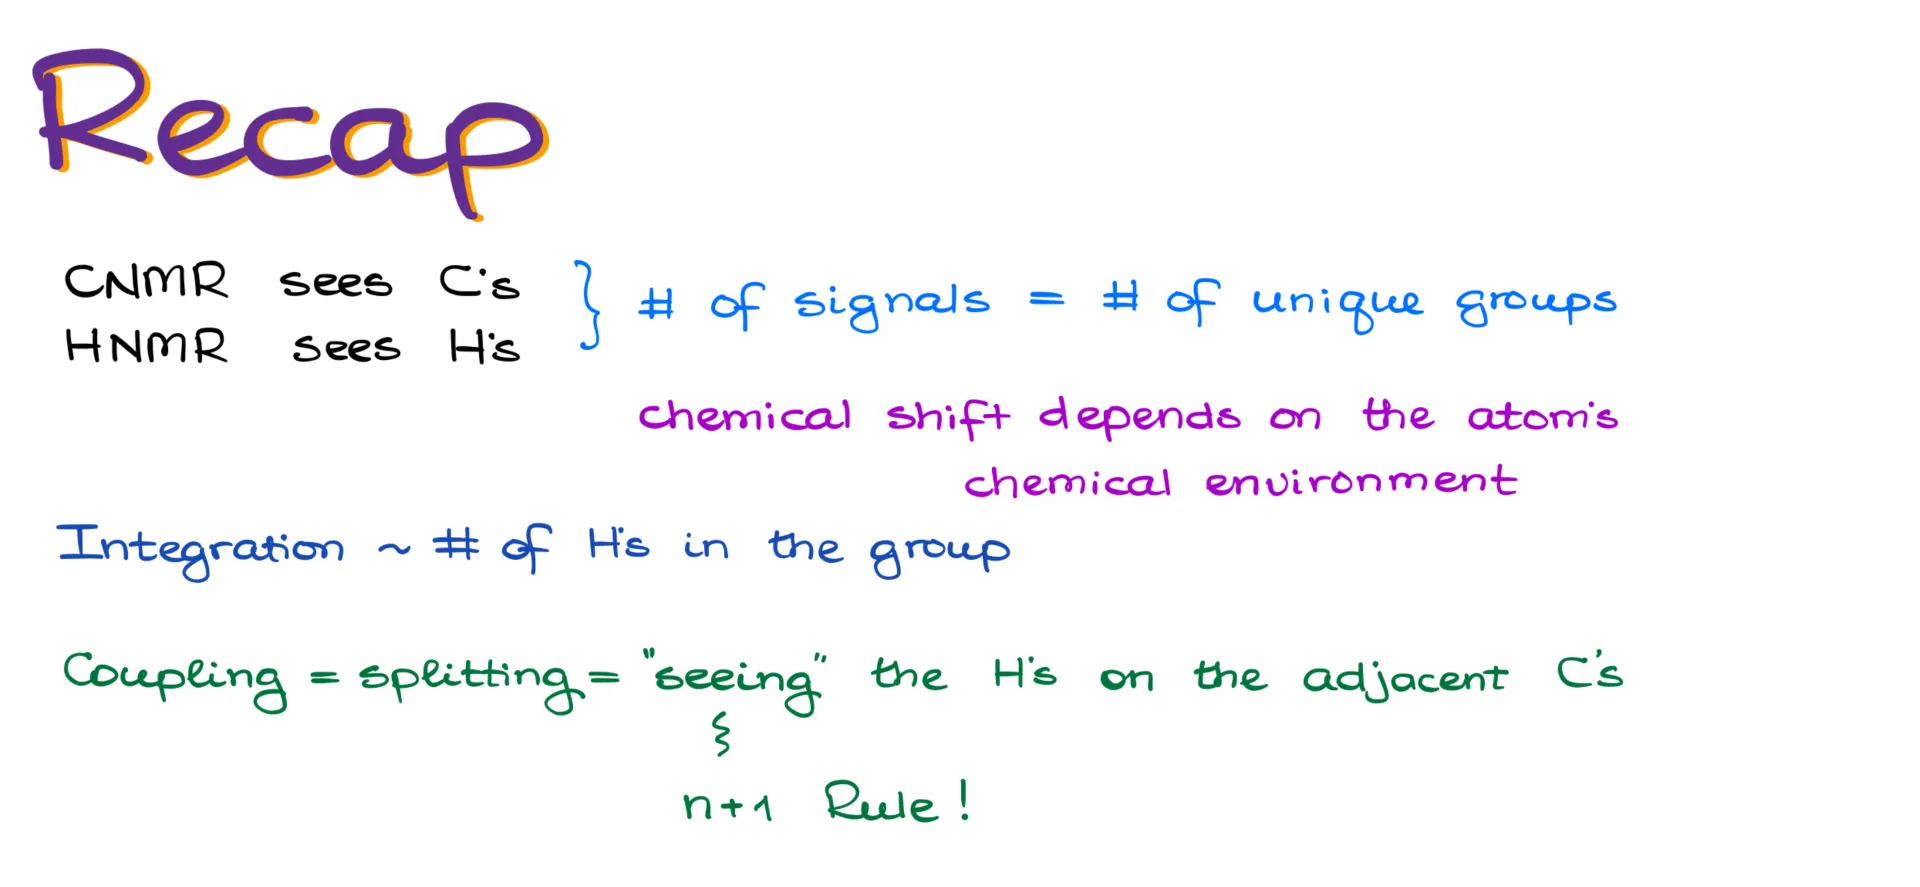
¹³C NMR shows us the carbon atoms in a molecule, while ¹H NMR reveals the hydrogens. The number of unique signals in each spectrum corresponds to the number of chemically distinct groups—either carbon or hydrogen—in the molecule. The chemical shift depends on the atom’s environment: electron-withdrawing groups and electronegative atoms deshield the atom and move its signal to the left. Integration tells us how many hydrogens are in each group (only applies to ¹H NMR). And finally, the hydrogens “see” their neighbors and reveal that interaction through splitting patterns. We use the n+1 rule to determine the pattern and Pascal’s triangle to estimate the relative peak heights.