Introduction to Mass-Spectrometry
In this tutorial, I want to talk about mass spectrometry, one of the must-know spectroscopic techniques that every organic chemistry student needs to understand. In this tutorial, we’re going to cover the fundamentals of mass spectrometry, what exactly you see on a spectrum, and finally, how to approach the analysis of mass-spec data.
How Mass-Spec Works
Imagine you have a molecule. The exact nature of the molecule doesn’t matter right now. We’re going to take this molecule and ionize it. While there are a ton of different ionization methods, the most common one is the electron beam that literally knocks out one electron from our molecule. That gives us an ion radical species, which we often refer to as the molecular ion. Since the molecule has lost an electron, it becomes a cation radical, if I want to be precise here.
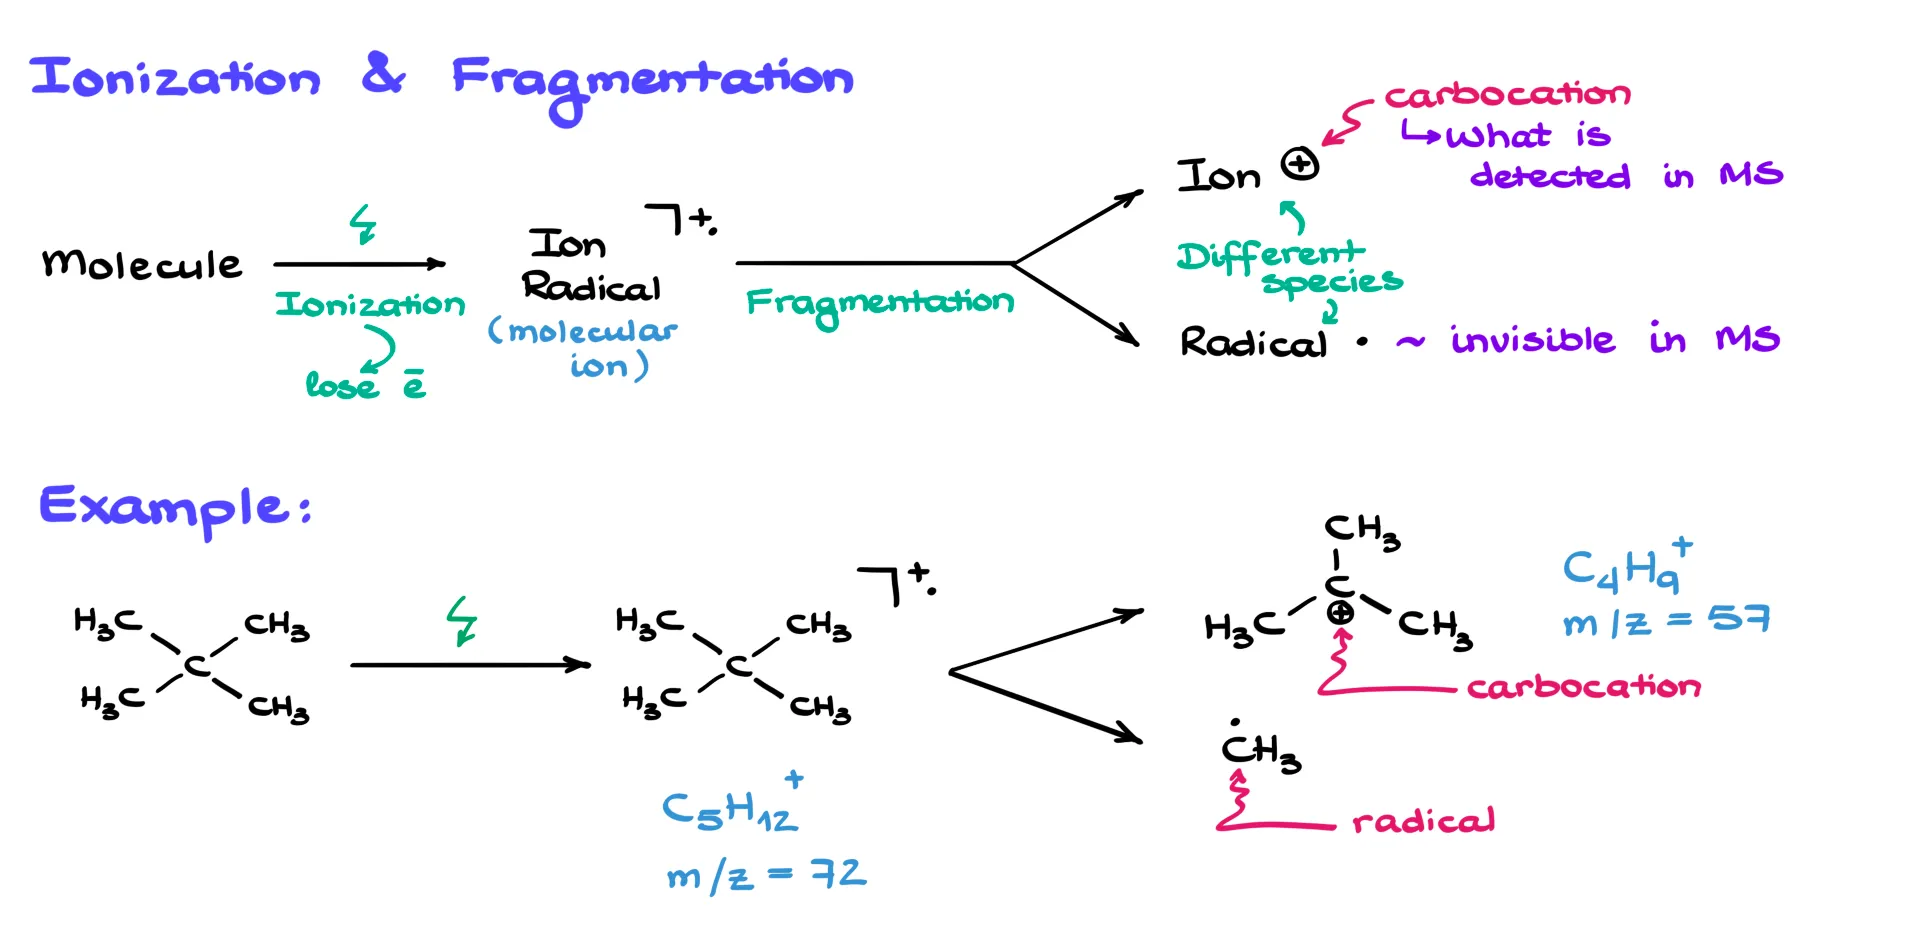
We usually represent it with a “+” and a “·” next to the structure and enclose the molecule in square brackets. The exact positions of the charge and the dot don’t matter, so we typically just show them together to the side.
Now, here’s something really interesting about ion radicals — they are quite unstable and tend to break apart. We call this process molecular decomposition or fragmentation. When this happens, the ion radical splits into two species: an ion and a radical.
And it’s very important to understand that those are two different species. One of them, the positively charged fragment, is a carbocation, and that’s the one that mass spectrometry actually detects. The other is a neutral radical, and that one is invisible in the mass-spec.
Mass spectrometry can only detect charged species. So, no matter how cool our radical might be, we will never see it. The only things we pay attention to in a mass spectrum are the carbocations that reach the detector.
For example, let’s look at neopentane. If we ionize neopentane in a mass spectrometer, it forms a radical cation that quickly fragments. One of the fragments is a tertiary carbocation, and the other is a methyl radical. The radical, as I mentioned, is invisible. So, the mass-spec will only show us the molecular ion at 72 amu and the tertiary carbocation fragment at 57 amu.
And this is where the main complication of mass spectrometry becomes obvious — the mass-spec doesn’t give you a structure. It only gives you ion masses. That’s it.
Mass Spectrum Example
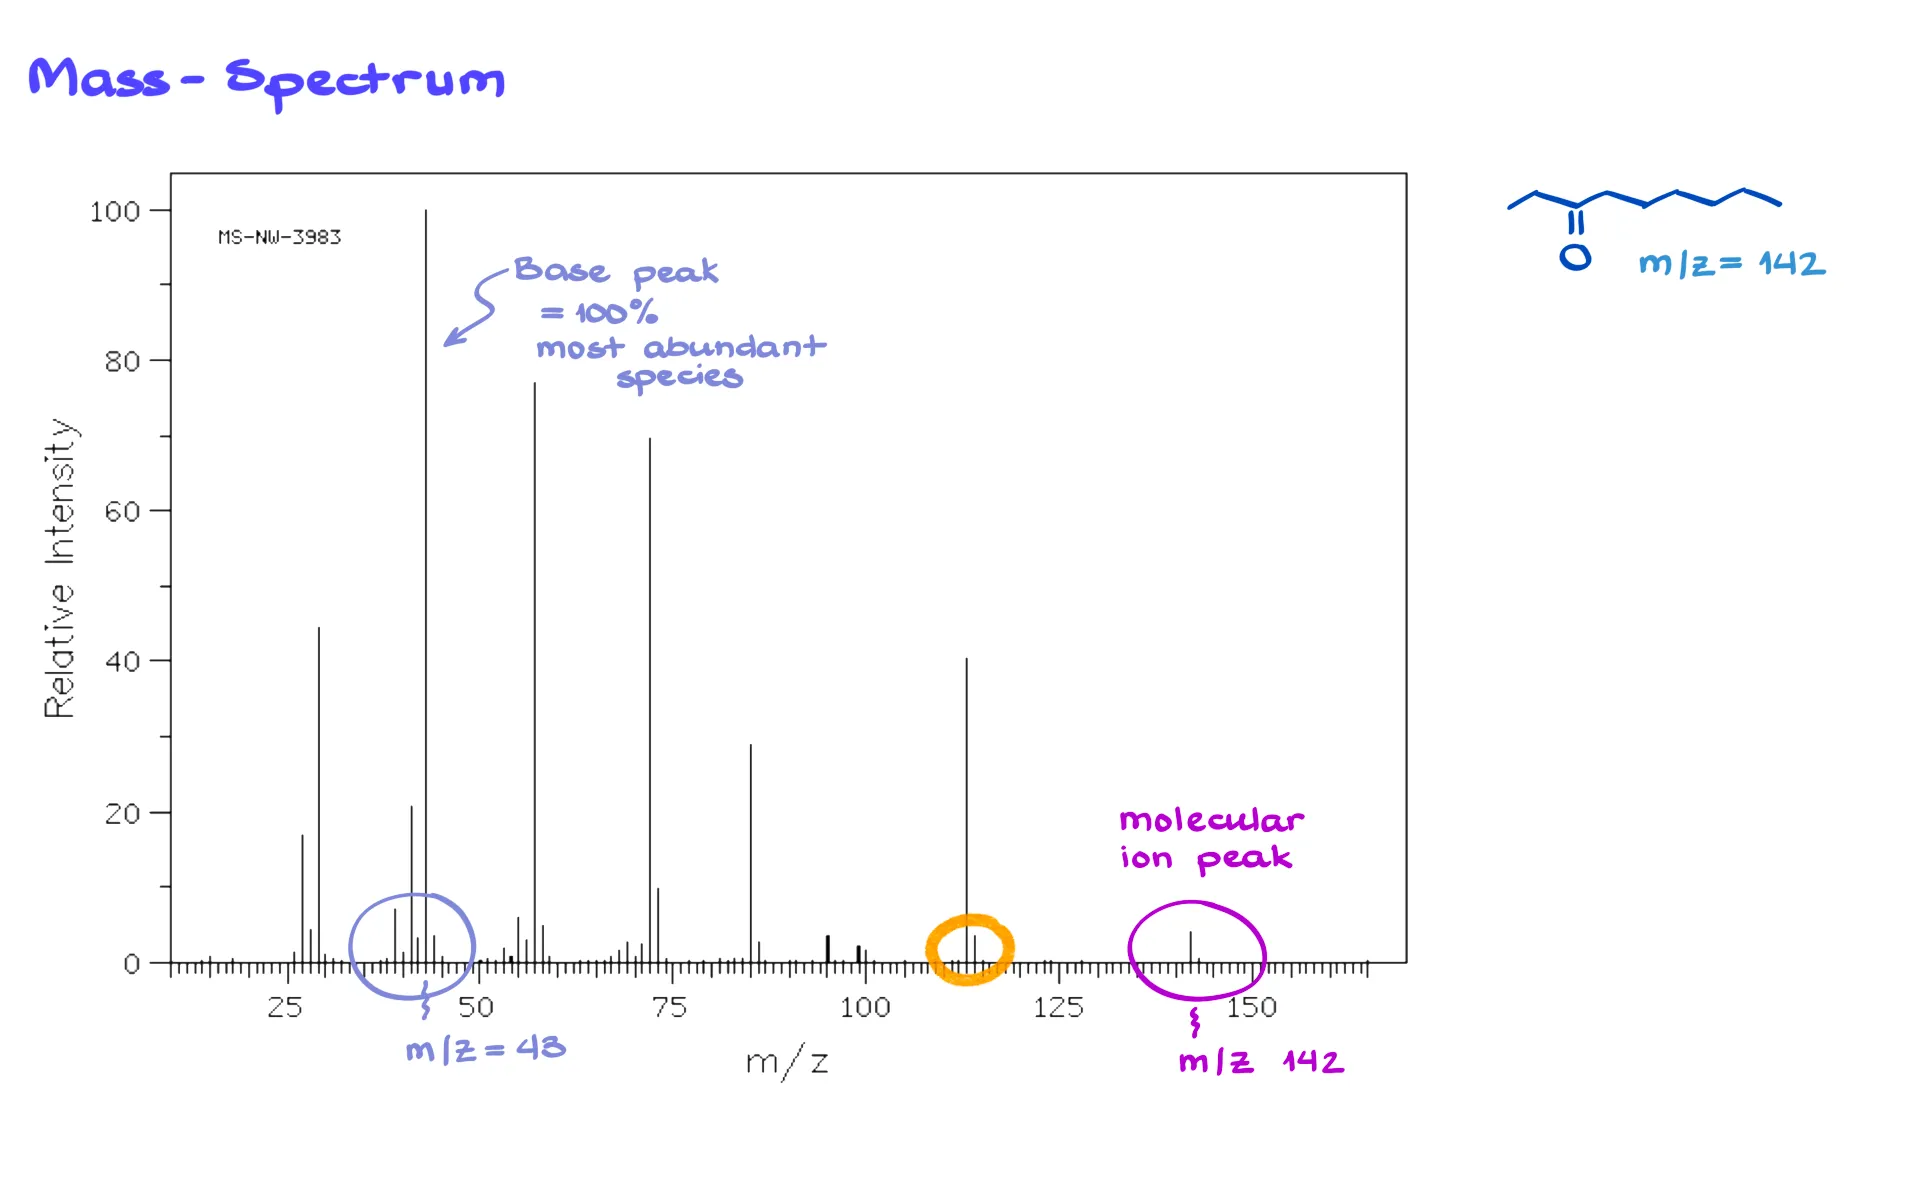
Here’s an example of a typical mass spectrum. As you can see, the only information you get are the ion masses — no structures of any kind. Kind of a bummer, but it’s what we’ve got to work with.
There are a couple of terms you absolutely need to know.
The first one is the molecular ion peak. This is the signal that corresponds to the ionized version of the original molecule — the radical cation we just talked about. This peak is usually fairly small because most molecules fragment before they reach the detector. Sometimes, for very small or exceptionally stable molecules, the molecular ion peak can actually be large or even the tallest peak. But for most organic compounds, especially larger ones, it might be weak or missing entirely because the molecule breaks apart too quickly.
The second important term is the base peak. This is the tallest peak in the spectrum — the most stable and most abundant ion formed during fragmentation. The base peak is always scaled to 100% intensity, and the rest of the peaks are shown relative to it.
That brings us to the axes of the spectrum.
The x-axis is labeled m/z, where m is the mass and z is the charge. In almost all examples you’ll see in this course, the charge is +1, which means the m/z value corresponds directly to the mass of the ion. Occasionally, a molecule can lose two or three electrons, giving +2 or +3 charged ions, but that’s extremely rare in an introductory setting.
The y-axis is the relative intensity or relative abundance. This scale is completely arbitrary. It’s normalized so that the base peak is 100%. So, the y-axis doesn’t really tell you how much material is present — it just shows how the different ion signals compare to each other.
Now, you’ve probably noticed that each signal on the spectrum isn’t a single sharp line but rather a small cluster of peaks. That happens because of the isotopic composition of the atoms in the molecule.
Let’s take a closer look at that.
Isotope Composition of Signals in Mass Spec
Here’s a fairly large molecule with the formula C₁₇H₁₆Cl₃NO. Different atoms have different naturally occurring isotopes. Remember from general chemistry — isotopes are atoms of the same element with the same number of protons but different numbers of neutrons, which makes them differ in mass.
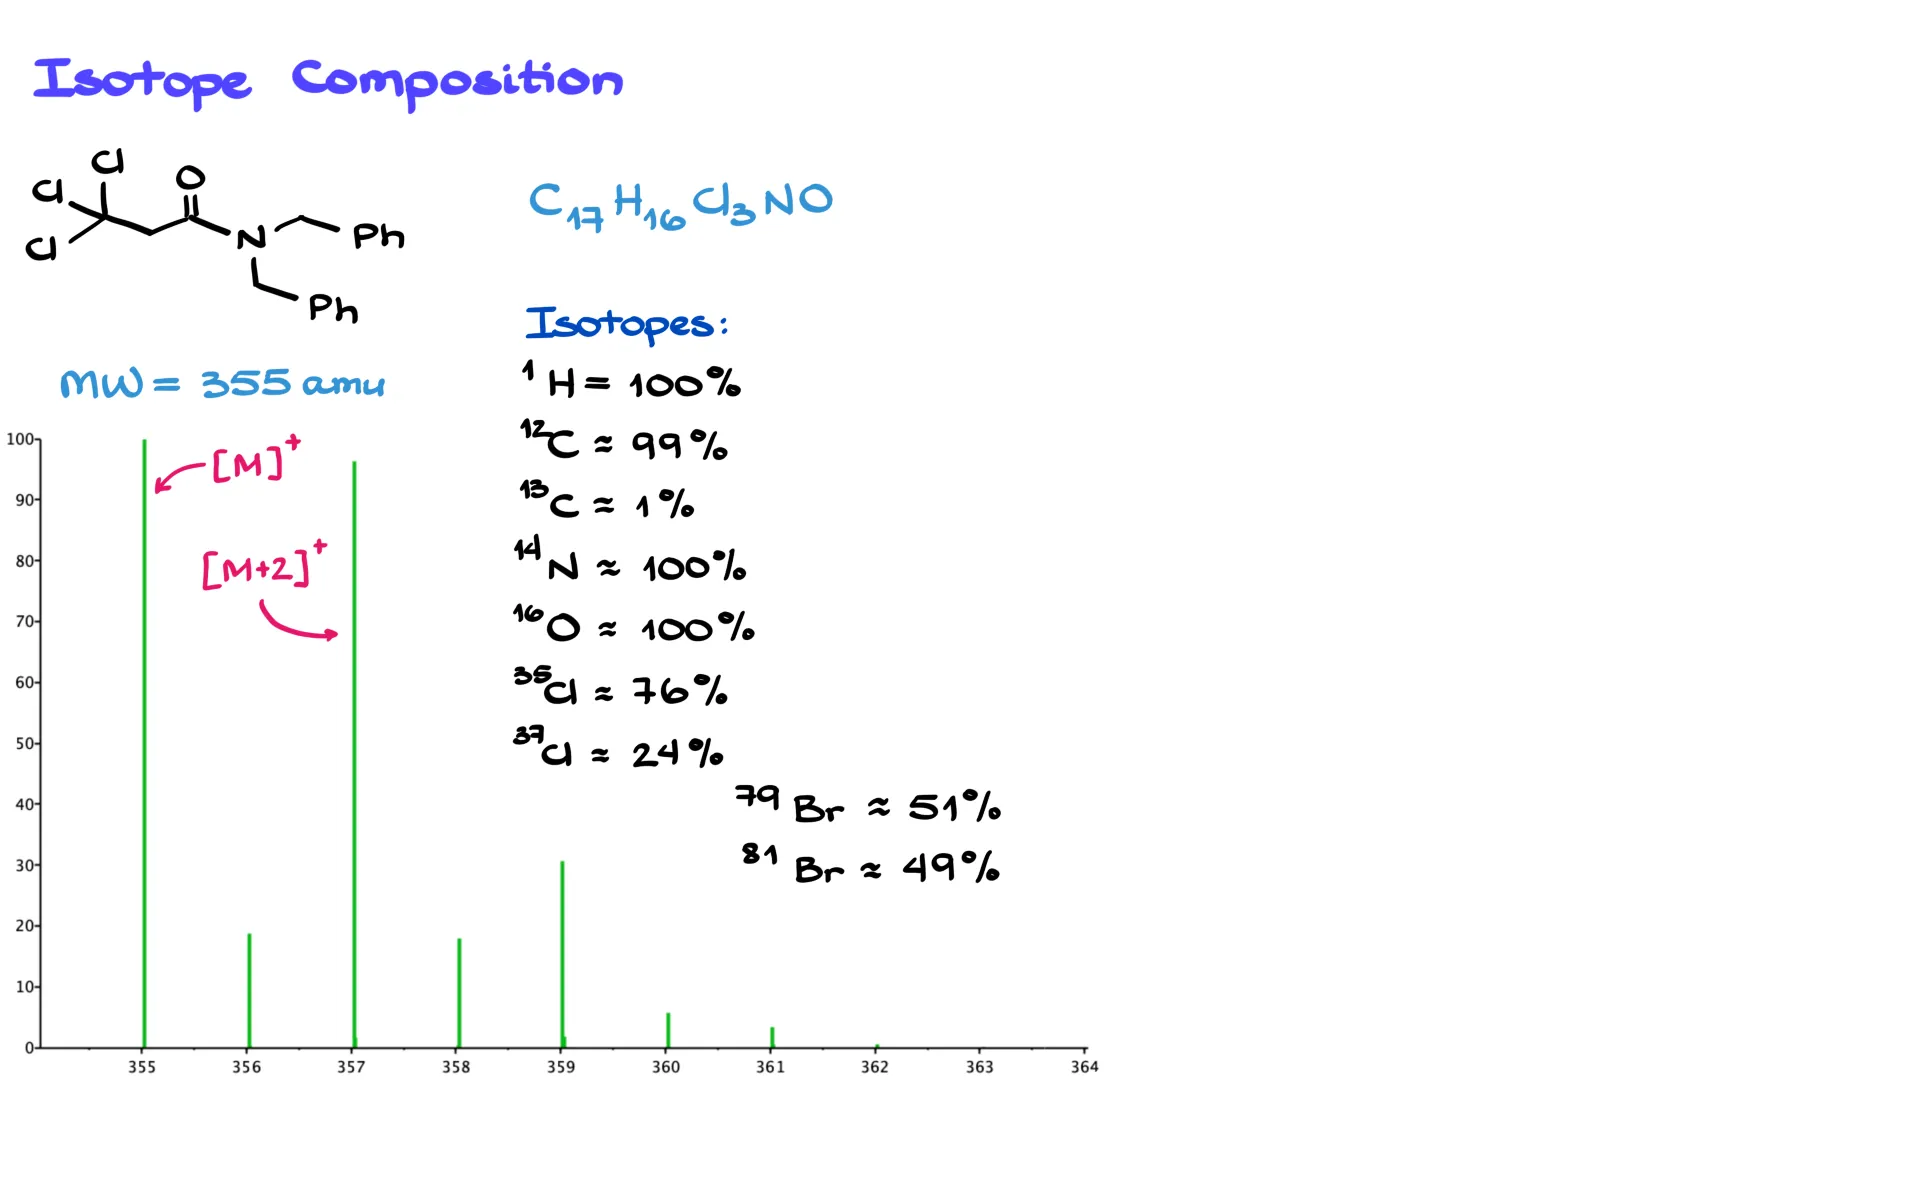
- For hydrogen, we’re basically dealing with ¹H, which makes up nearly 100% of all hydrogen atoms.
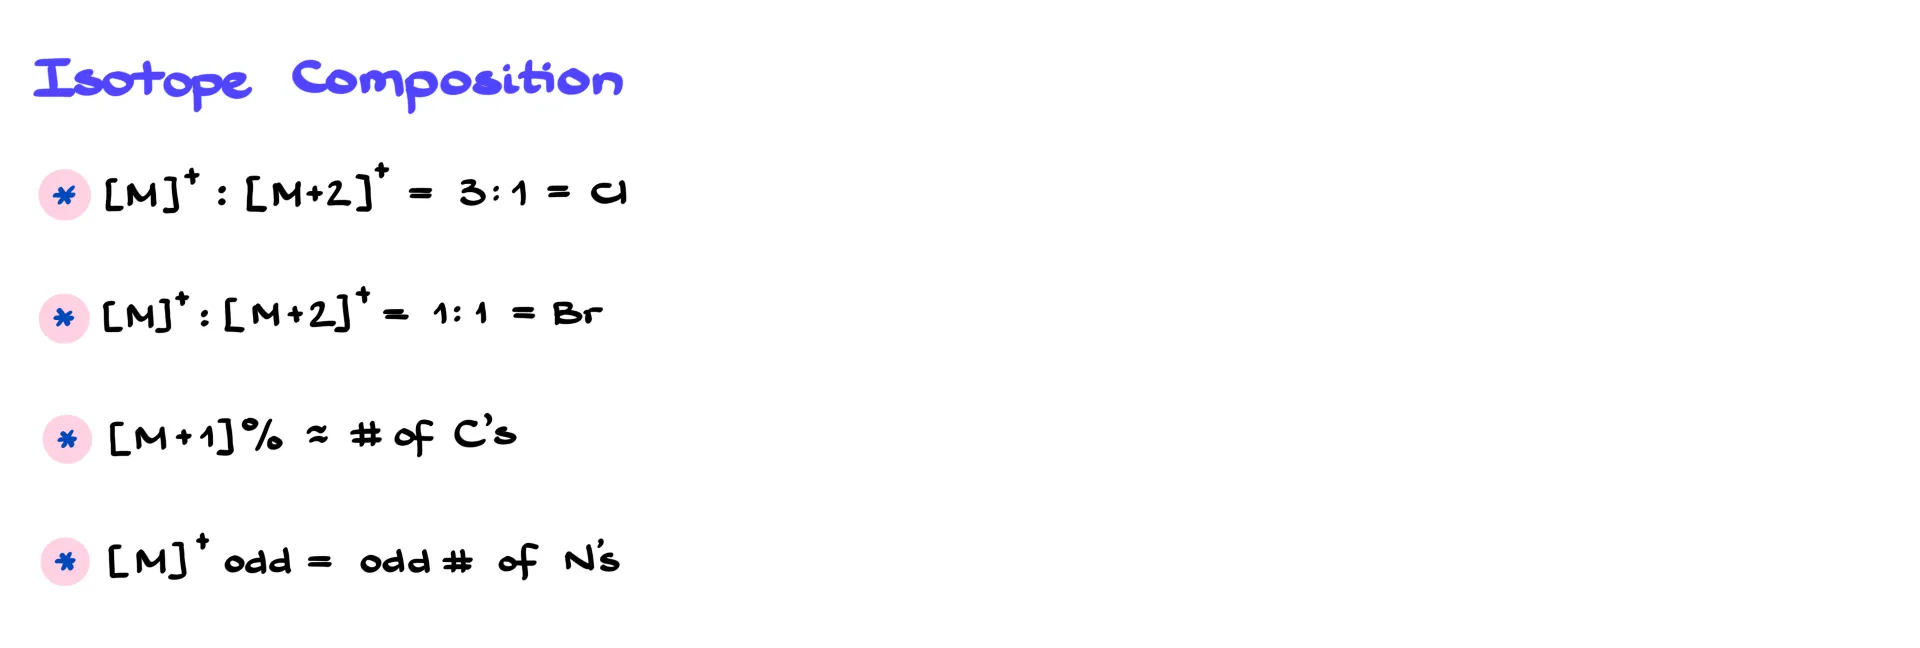
- Carbon has two stable isotopes — ¹²C (about 99%) and ¹³C (about 1%). The more carbons a molecule has, the higher the probability that one or more will be ¹³C, which leads to small M+1, M+2, and higher peaks.
- Nitrogen and oxygen are essentially all ¹⁴N and ¹⁶O in organic molecules, the other isotopes are negligible.
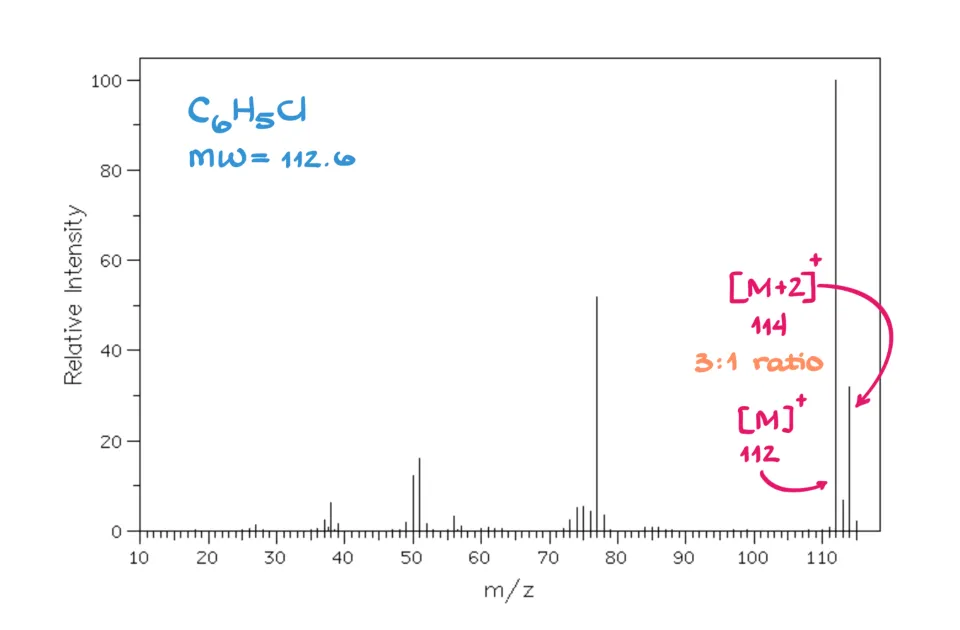
- But chlorine is the big difference. It exists as ³⁵Cl (about 76%) and ³⁷Cl (about 24%). That means if your molecule contains chlorine, you’ll always have molecules with light and heavy chlorines mixed together.
If you look at the molecular ion cluster for a chlorinated compound, you’ll see peaks at M and M+2, with a ratio of roughly 3:1 (or sometimes 4:1) — a dead giveaway for chlorine.
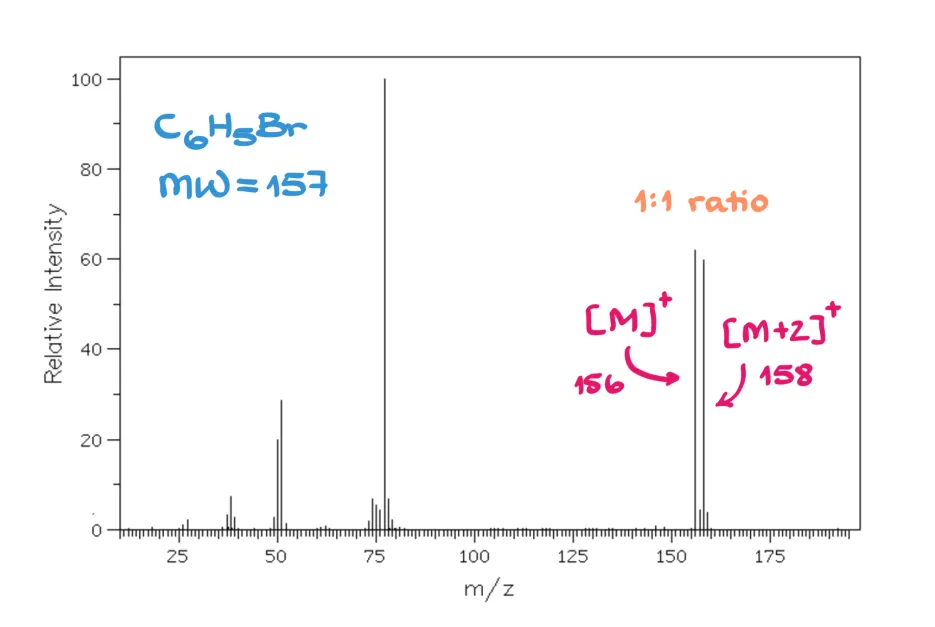
Similarly, bromine has two stable isotopes, ⁷⁹Br and ⁸¹Br, in about a 1:1 ratio. So, a bromine-containing compound will give M and M+2 peaks that are equal in height — a perfect 1:1 pattern.
And that’s really all you need to memorize for isotope patterns.
If you see a 3:1 or 4:1 M and M+2 pattern — you’ve got chlorine.
If you see a 1:1 M and M+2 pattern — you’ve got bromine.
In addition, you can use the intensity of the M+1 peak to estimate the number of carbons in your molecule since each ¹³C adds about 1% contribution.
Another useful rule is the nitrogen “rule” — if your molecular ion has an odd mass number, you have an odd number of nitrogen atoms in the molecule (1, 3, 5, etc.). For typical organic compounds composed of C, H, O, and N, this rule works really well.
Unfortunately, there are no similar tricks for other atoms like oxygen, sulfur, or phosphorus, so for those, mass spectrometry alone often isn’t enough. You’ll need to combine it with other techniques like IR or NMR, or have a molecular formula to work from.
Fragmentation Patterns
Now, if we return to the spectrum, you’ll notice that in addition to the molecular ion and base peak, there are many other peaks. These come from fragmentations — the breaking of the ionized molecule into smaller charged pieces.
Let me explain how that works.
Once the molecule is ionized, it can fragment in many different ways. Each new charged fragment creates its own signal on the spectrum. So, for a large molecule, you’ll typically see a molecular ion peak, then fragment peaks labeled ion 1, ion 2, ion 3, and so on. Each peak corresponds to a specific carbocation formed during fragmentation.
The mass spectrum for a large molecule might look like a forest of peaks. The tallest one is the base peak, and the rest correspond to different fragment ions. The radicals formed at the same time are neutral and therefore invisible in the spectrum.
Example 1
So, can we predict where a molecule will fragment? Actually, yes — and the trick is to look for the most stable carbocations that can form.
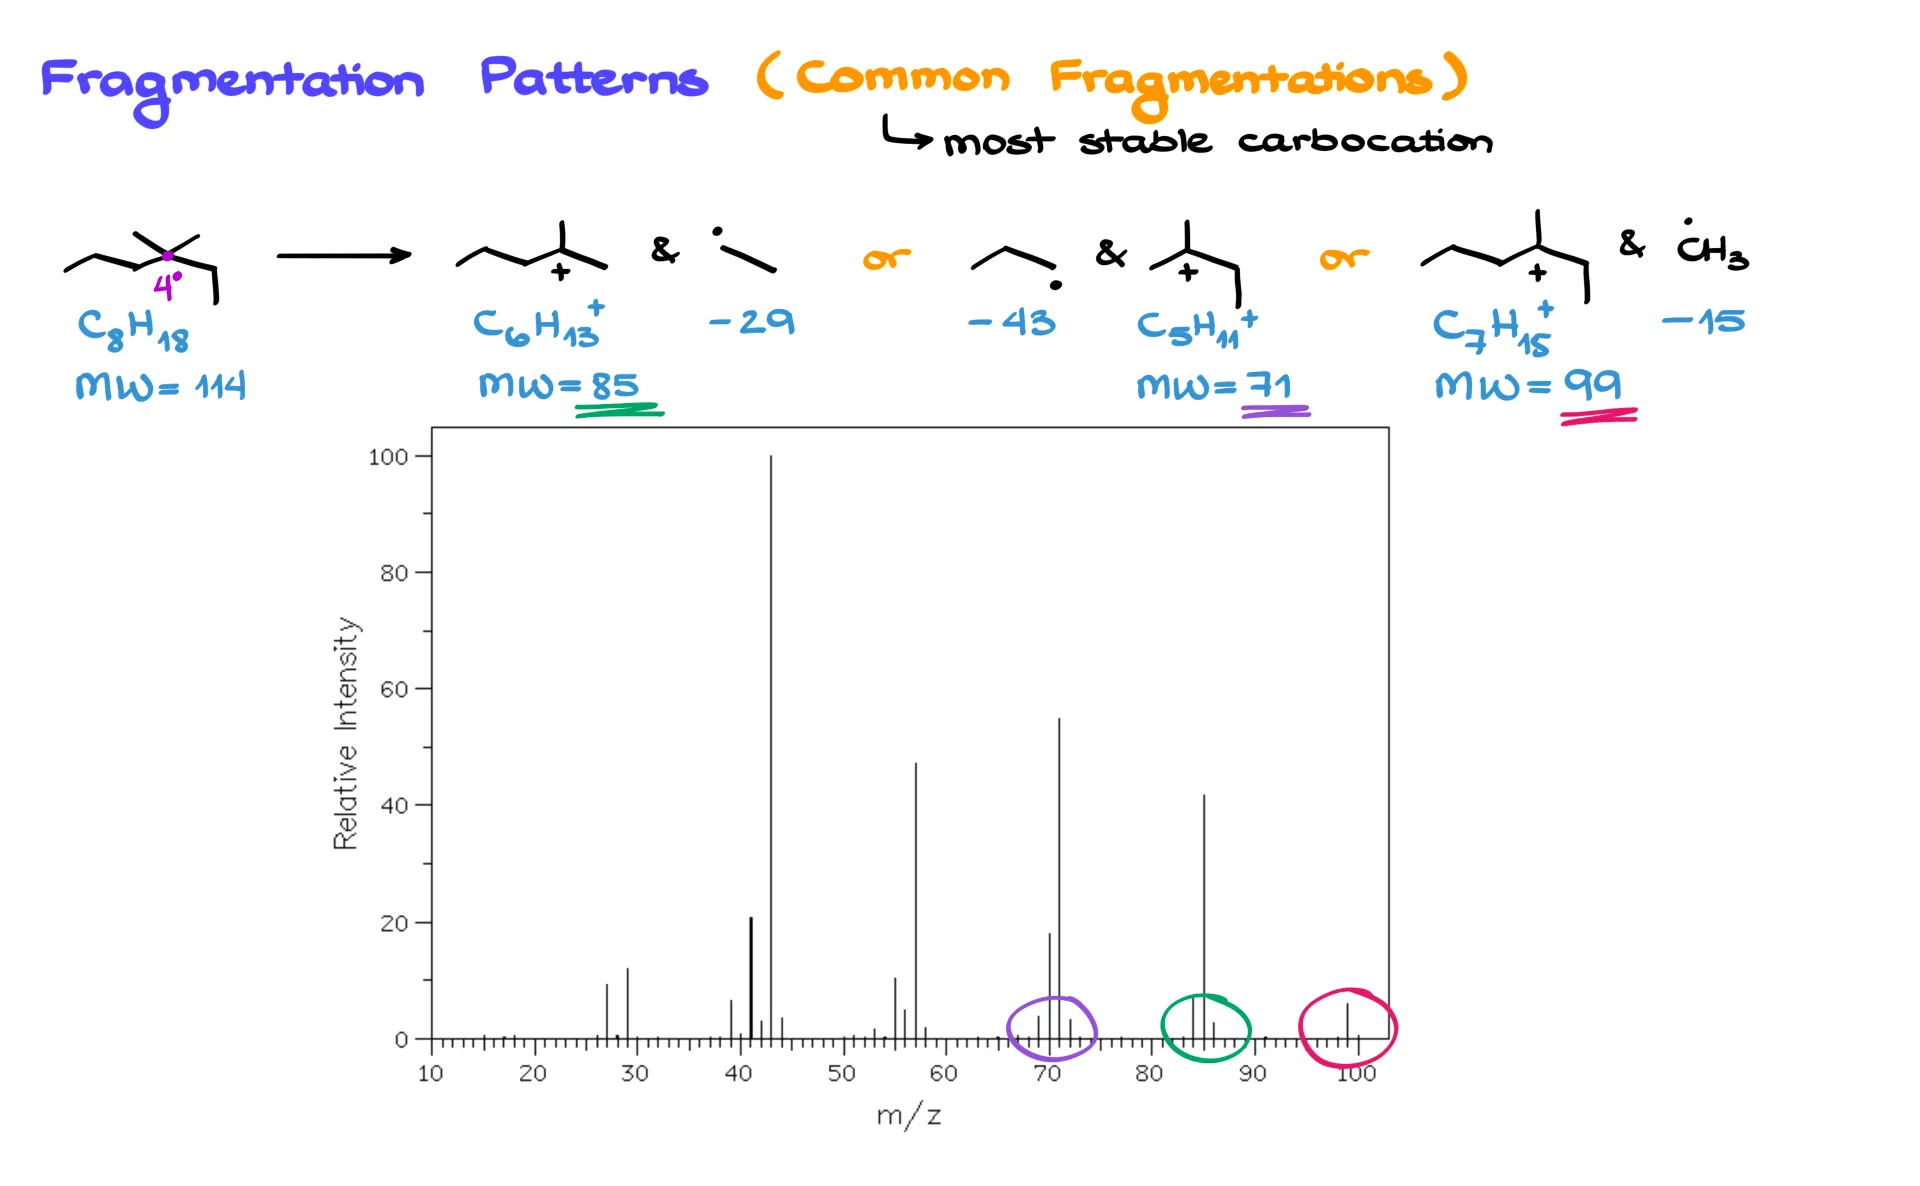
Let’s take a look at 3,3-dimethylhexane. It has a quaternary carbon in the middle. If the molecule breaks next to that atom, we can form a tertiary carbocation, which is relatively stable. Depending on where the cleavage occurs, we can lose an ethyl radical, a propyl radical, or a methyl radical, producing several different carbocations with different masses.
When you check the mass spectrum for this molecule, you’ll see signals that correspond exactly to those predicted fragments — peaks at 99, 85, and 71 amu, along with the molecular ion at 114 amu, which may or may not appear depending on how unstable the molecule is.
Example 2
Now let’s look at a case where resonance helps stabilize a carbocation. Here’s 3-methylpentan-3-ol. The tertiary carbon attached to oxygen is a great place for fragmentation because the resulting carbocation can be stabilized by resonance with the oxygen’s lone pairs.
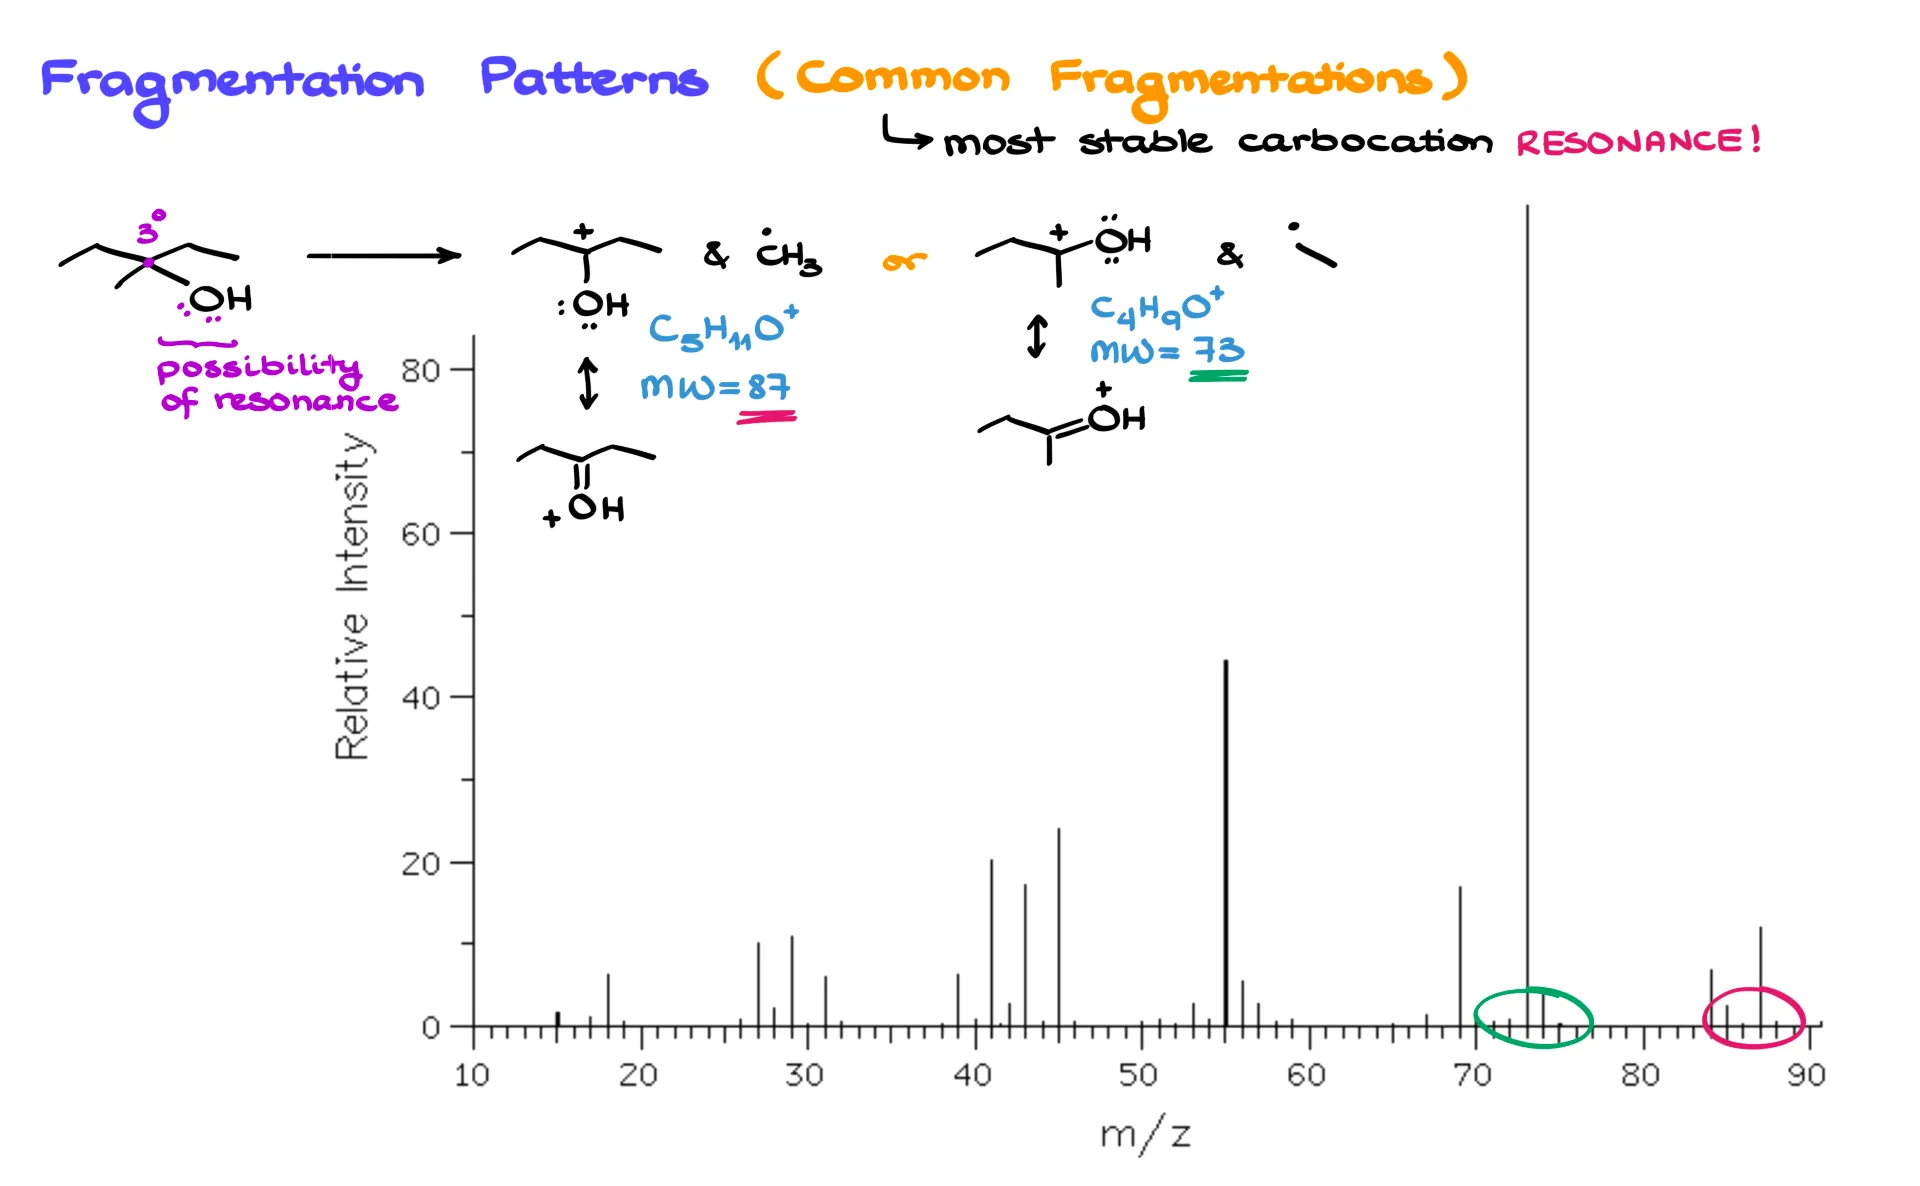
If we break one way, we lose a methyl radical and get a resonance-stabilized carbocation at 87 amu. If we break another way, we lose an ethyl radical and get a carbocation at 73 amu. And sure enough, when you look at the spectrum for this molecule, you’ll see peaks at 87 and 73 — exactly as predicted.
So, while mass spectrometry might feel like a lot of number-crunching (and trust me, it often is), there’s a clear logic behind it. If you can predict the most stable carbocations, you can usually identify the first round of fragmentations without too much trouble.
Of course, spectra can get messy fast because fragmentations don’t always happen in a simple step-by-step way. You can have branching fragmentation paths that form complex “trees” of ions. But with some practice, you’ll start developing a feel for the patterns, and identifying fragments will become second nature.
Spectroscopy is like solving a puzzle — the more puzzles you solve, the better you get.
Reference for the spectra used in this tutorial: SDBS : https://sdbs.db.aist.go.jp/ , National Institute of Advanced Industrial Science and Technology, date of access: 10-11-25